


Strategic Guardrails: Mastering Risk Management with Options Trading Alert Services
Strategic Guardrails: Mastering Risk Management with Options Trading Alert Services
Risk management with options trading alert services comes down to one idea: the alert gives you a chart setup, and you supply the guardrails. No alert service controls how much you put on, where you bail, or how you react when a contract moves fast against you. That part is yours. The traders who last know the service’s methodology, spread their exposure, size every idea with a fixed rule, and define their stop before they click buy. They study the Greeks so volatility doesn’t blindside them, and they review their decisions on a schedule. In this guide, we’ll walk through each guardrail in the order you should build them, with hypothetical examples and the math you need.
An alert is an educational idea, not an instruction to bet the account. Size every trade so a full loss barely registers, decide your stop and target before you act, and keep your exposure spread across sectors and strategies. Discipline, not the alert, determines whether you survive long enough to get good.
| Risk per idea | 1% to 2% of account for most traders (5% is the absolute ceiling) |
| Sector concentration | No single sector carrying more than about a third of open risk |
| Stop framework | Premium-based, underlying-based, or time-based, set before you act |
| Kelly usage | Fractional Kelly (quarter to half) as an upper bound, never full Kelly |
| Review cadence | Weekly journal review, monthly rule check |
What Should You Understand About an Alert Service Before Trading It?
You need to know how the alerts are built, what kind of options strategies they use, and how the service reports its history. If you can’t explain why an alert was sent, you can’t manage the risk of acting on it.
Start with methodology. Is the service technical, catalyst-driven, flow-based, or a blend? Are the setups single-leg calls and puts, which carry higher volatility, or defined-risk spreads? A service focused on short-dated directional contracts demands much smaller sizing than one built around spreads. Our guide on options alert services basics covers these categories in detail.
Next, read the track record critically. Look for every alert reported, including the ones that fell short, along with clear definitions of each metric. If a service shows only highlight reels or promises consistent percentages, walk away. Here are the red flags before you subscribe.
Alert price: the price of the option contract at the time the alert was published. It’s a reference point, not a fill you’re guaranteed to get.
The high: the highest recorded price the alerted contract reached after publication, often shown as “a high of +X%.” It’s a historical data point, not a captured or typical result, and it should never be read as what you’d realistically get.
Once you understand those definitions, you’ll read any service’s numbers more honestly. For a look at how we structure our own educational setups, see how our trade alerts work.
How Do You Diversify When You’re Following Alerts?
You diversify by capping how much of your total risk sits in any one ticker, sector, strategy, or expiration week. Following alerts doesn’t mean acting on every one at full size.
Spread across underlyings and strategies. If you hold five bullish call trades on five different chip stocks, you don’t have five ideas. You have one idea placed five times. Mix directional trades with defined-risk structures, and don’t let a single strategy type dominate your book.
Watch sector exposure. Alerts often cluster in whatever sector is moving. A strong tech week can produce several tech setups in a row, and a single industry-wide downturn can hit all of them at once. Track open risk by sector and pass on new ideas once a sector hits your cap.

Stagger expirations. Options add a dimension stocks don’t have: time. If everything expires the same Friday, one bad week can erase a month of careful work. Spreading expirations smooths out the theta decay and event risk you’re carrying.
Keep a simple open-risk tracker with four columns: ticker, sector, expiration, and dollars at risk. Before you act on any new alert, glance at it. If the new idea would push one sector or one expiration week past your limit, skip it or size it down. Thirty seconds of checking prevents most concentration blowups.
How Much Should You Risk on Each Alert?
Most traders should risk 1% to 2% of their account on any single idea, with 5% as a hard ceiling. Sizing is the single most important guardrail, because it decides whether a bad streak is an annoyance or a disaster.
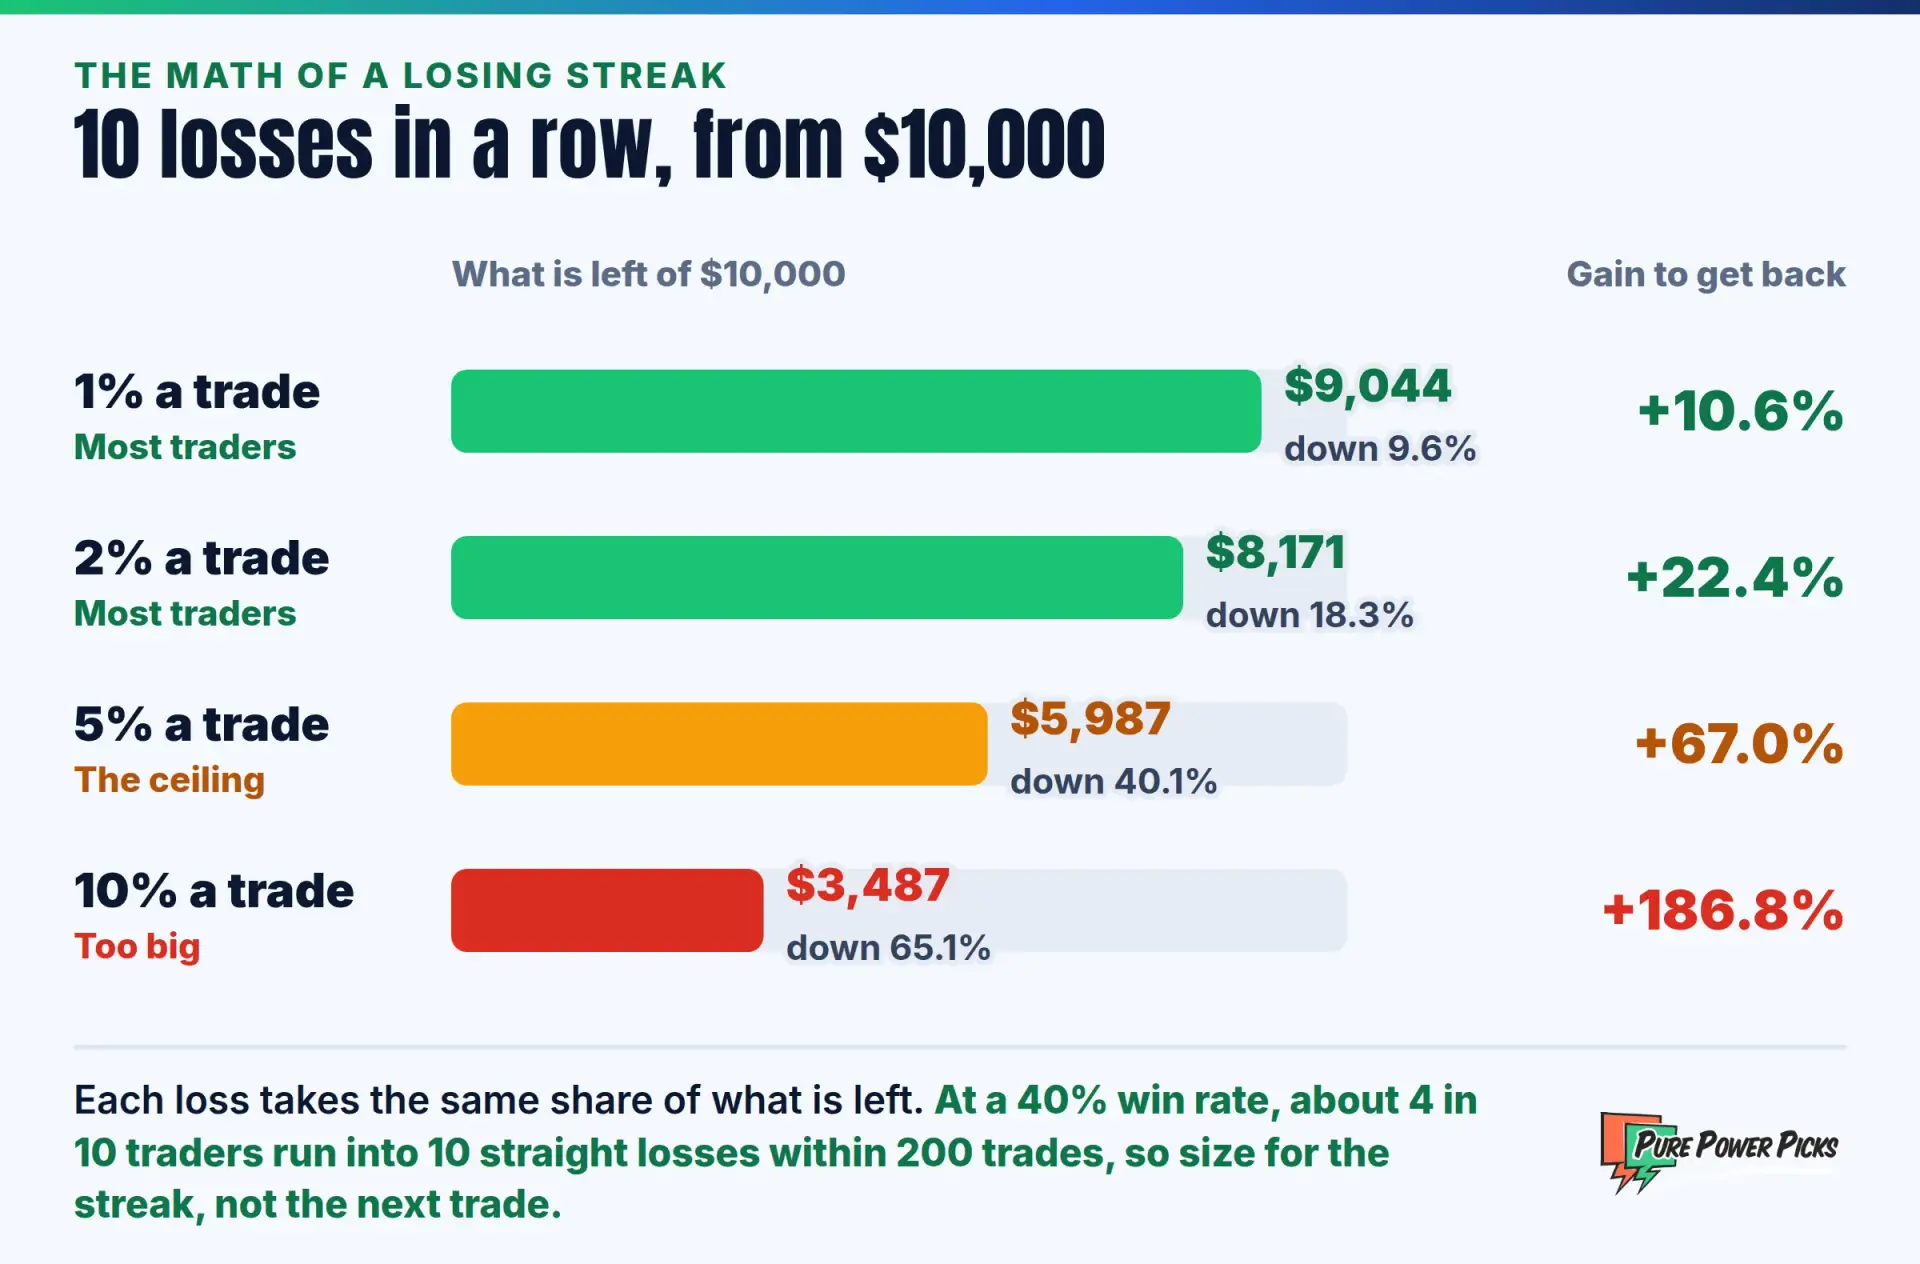
The fixed percentage rule. Pick a percentage of your account and risk only that much per trade. Note that “risk” means what you’d actually lose if your stop triggers, not the total premium, unless you plan to hold to expiration. Then the full premium is your risk.
Here’s a hypothetical example. You have a $10,000 account and a 2% rule, so your maximum risk is $200. An alert highlights a call trading around $2.00, which is $200 per contract. If your plan is to cut the trade if the contract loses half its value, your risk per contract is $100, so you could take two contracts. If you’d hold to expiration with no stop, your risk is the full $200, so you’d take one.
The Kelly Criterion. More advanced traders use the Kelly Criterion to estimate an optimal bet size from your historical win rate and your average win-to-loss ratio. The simplified formula is K = W − (1 − W) / R, where W is your win rate and R is your average win divided by your average loss.
Hypothetically, if your own journaled trades show a 50% win rate and your average win is twice your average loss, Kelly suggests 0.50 − 0.50 / 2 = 25% of capital per trade. That’s far too aggressive for options, where estimates are noisy and outcomes swing hard. That’s why serious traders use quarter or half Kelly purely as an upper bound. Dig into the full math in our guide to position sizing for options.
| Method | How It Works | Best For |
|---|---|---|
| Fixed % | Risk a set percentage (1% to 2%) of current account value | Beginners and most intermediate traders |
| Fixed dollar | Risk the same dollar amount on every idea | Small accounts that want simplicity |
| Fractional Kelly | Kelly output cut to a quarter or half, used as a cap | Experienced traders with a large trade journal |
As your skill and account grow, increase size gradually and by rule, not by mood. Our guide on how to scale your trading size safely lays out a step-up framework.
How Should You Set Stops and Targets on Options?
Decide your stop and your target before you act, based on the setup and your risk budget. Options move fast, and a decision made mid-move is almost always worse than one made in advance.
Choose a stop framework. Traders typically use one of three. A premium stop means you cut if the contract loses a set percentage, such as 30% to 50%. An underlying stop means you cut if the stock breaks the level that invalidates the chart setup. A time stop means you cut if the move hasn’t happened within a set number of days, before theta eats the rest. The ideal stop usually ties back to the chart, not an arbitrary number.
Be careful with resting stop orders. A standard stop-loss order on an option can fill far from your price when bid-ask spreads are wide or the market gaps. Many traders set alerts on the underlying, or use stop-limit orders, and act manually when the level breaks. Knowing when to cut your losses without hesitation is a skill worth practicing.
Set targets in advance, too. Options can give back a big move in a single session. A planned target, or a scale-out plan where you take part off at a first level and trail the rest, keeps you from watching a good trade round-trip. Pair your target with your stop to check the risk-reward ratio before you commit. For specific frameworks, read our guides on taking profits and setting stops and using trailing stops to protect profits.
Never anchor your target to the high a past alert reached. That figure is the single best moment after publication, and almost no one fills at the absolute top. Build your targets from the chart and your own risk-reward math, and accept that many setups will fall short entirely.
Why Does Options Education Matter for Risk Management?
Because you can’t manage a risk you don’t understand. The Greeks tell you exactly how your contract will react to price, time, and volatility, and that’s the information alerts can’t give you on your behalf.
Here’s the short version of the options Greeks:
- Delta: how much the option moves per $1 move in the stock. It’s also a rough gauge of directional exposure.
- Gamma: how fast delta changes. High gamma near expiration means wild swings in both directions.
- Theta: how much value the option loses each day from time decay. Buyers fight it every day they hold.
- Vega: sensitivity to implied volatility. After earnings, a volatility crush can sink a contract even if the stock moves your way.

If you’re newer to options, the SEC’s investor guide to options is a solid, neutral primer. Then work through our beginner’s walkthrough on how to use trading alerts so you know what to check before acting on any setup.
How Do You Stay Disciplined When an Alert Creates Urgency?
You stay disciplined by writing your rules down before the market opens and treating them as non-negotiable. An alert hitting your phone creates a feeling of urgency, and urgency is where fear and greed take over.
Stick to the plan. Your trading plan should spell out which alerts you’ll act on, your max risk per idea, your stop and target rules, and your daily loss limit. If the contract has already run well past the alert price, the plan should tell you whether to pass. Chasing is the most common way alert followers overpay. Our step-by-step guide shows how to build a winning trading plan.
Review and learn. Journal every trade: why you took it, your size, your planned stop and target, and what you actually did. Each week, look for patterns. Did you move stops? Size up after a hot streak? Skip your rules after a loss? The goal isn’t to judge outcomes. It’s to judge whether you followed your process. For more rules that keep traders in the game, see our options risk management rules.
Put it all together and the picture is clear. An alert service can sharpen your idea flow and accelerate your learning, but your guardrails are what protect your account. Understand the service, spread your risk, size by rule, plan your stops, keep learning, and hold yourself accountable.
Frequently Asked Questions
Should I act on every alert a service sends?
No. Treat alerts as a menu of educational ideas. Act only on the ones that fit your plan, your sector limits, and your risk budget, and pass on anything that has already moved far beyond the alert price.
What percentage of my account should I risk per options trade?
Most traders do well with 1% to 2% per idea, and 5% should be treated as an absolute ceiling. Smaller sizing lets you survive the inevitable losing streaks while you build skill.
Are stop-loss orders reliable on options?
They can be unreliable when spreads are wide or prices gap, which can cause poor fills. Many traders set price alerts on the underlying stock or use stop-limit orders, then act manually when their level breaks.
What does “a high of +X%” mean on an alert history?
It’s the highest recorded price the alerted contract reached after publication compared with the alert price. It’s a historical data point, not a typical or captured result, and it should never be used to project future outcomes.
Is the Kelly Criterion good for beginners?
Usually not. Kelly needs an accurate win rate and win-to-loss ratio from a large sample of your own trades. Beginners are better served by a simple fixed percentage rule until they’ve built a meaningful journal.
Pair Clear Chart Setups With Your Own Guardrails
Pure Power Picks is built education-first: chart setups with the reasoning behind them, so you can apply your own sizing, stops, and plan. If you’re ready to sharpen your process with a steady flow of ideas, explore our membership options.
See Membership Plans
The PPP Team is the research and editorial team behind Pure Power Picks. We trade stocks and options and publish the work as we do it, with every alert tracked in public. Publishing since 2020. How we research and correct our work is written out in our editorial standards. Our content is strictly educational, never advice.
Disclaimer: The content on Pure Power Picks is for educational and informational purposes only and does not constitute financial, investment, or trading advice. We are not registered financial advisors. Options trading involves substantial risk and is not suitable for every investor; you can lose some or all of your invested capital. All examples in this article are hypothetical and for illustration only. Alerts are educational chart setups, not recommendations or executed trades, and any historical data such as an alert’s high does not indicate future results. Always do your own research and consult a licensed financial professional before making investment decisions.