

How to Build a Winning Trading Plan: A Step-by-Step Guide for Traders
A trading plan is a short written document that says what you trade, when you get in, when you get out, and how much you can lose on any one trade. You write it when the market is closed and your head is clear, so that the version of you sitting in a live trade only has to follow it.
Most traders skip this step, and it shows. Without written rules, every decision gets made in the moment, under pressure, with money on the line. This guide walks through the eight parts of a plan, gives you a template to copy, and shows the math behind the rules. We also took the sample rule from the template and tested it on 148 real breakouts, because a plan should be checked against real prices before it is trusted with real money.
In this guide, we will break down:
- What a trading plan is
- Why every trader needs one
- How to build a trading plan step by step
- Tools to help you stay on track
- Common mistakes to avoid
A trading plan does not predict the market. It decides, in advance, what you will do in each outcome: where you enter, where you are wrong, what that costs, and when you take the gain. A plan cannot make a trade work. It can make sure one bad trade or one bad week does not end your account.
| What it is | A written set of rules for what, when and how much you trade |
| Core parts | Goals, setup, entry and exit rules, risk rules, journal, routine, backtest, review |
| Common risk rule | Risk 1% to 2% of the account on any one trade |
| Sizing formula | Dollars at risk ÷ (entry minus stop) = shares |
| Number to know | Expectancy: the average result per trade, measured in R |
| Time to write | One sitting for a first draft, then a monthly review |
What Is a Trading Plan?
A trading plan is a written document that defines your strategy, goals, risk limits, entry and exit rules, and how you manage a trade once you are in it. Think of it as a business plan for your trading account. A business plan does not guarantee sales, and a trading plan does not guarantee gains. Both exist so that decisions follow a process instead of a mood.
Investopedia defines a trading plan as a systematic method for identifying and trading securities that accounts for time, risk and the investor’s objectives. The word that matters is systematic: the same situation gets the same response every time.
A trading plan is a written rulebook for your own trading: what you trade, the setup you wait for, where you enter, where you exit for a loss, where you exit for a gain, how big the position is, and how you review the results.
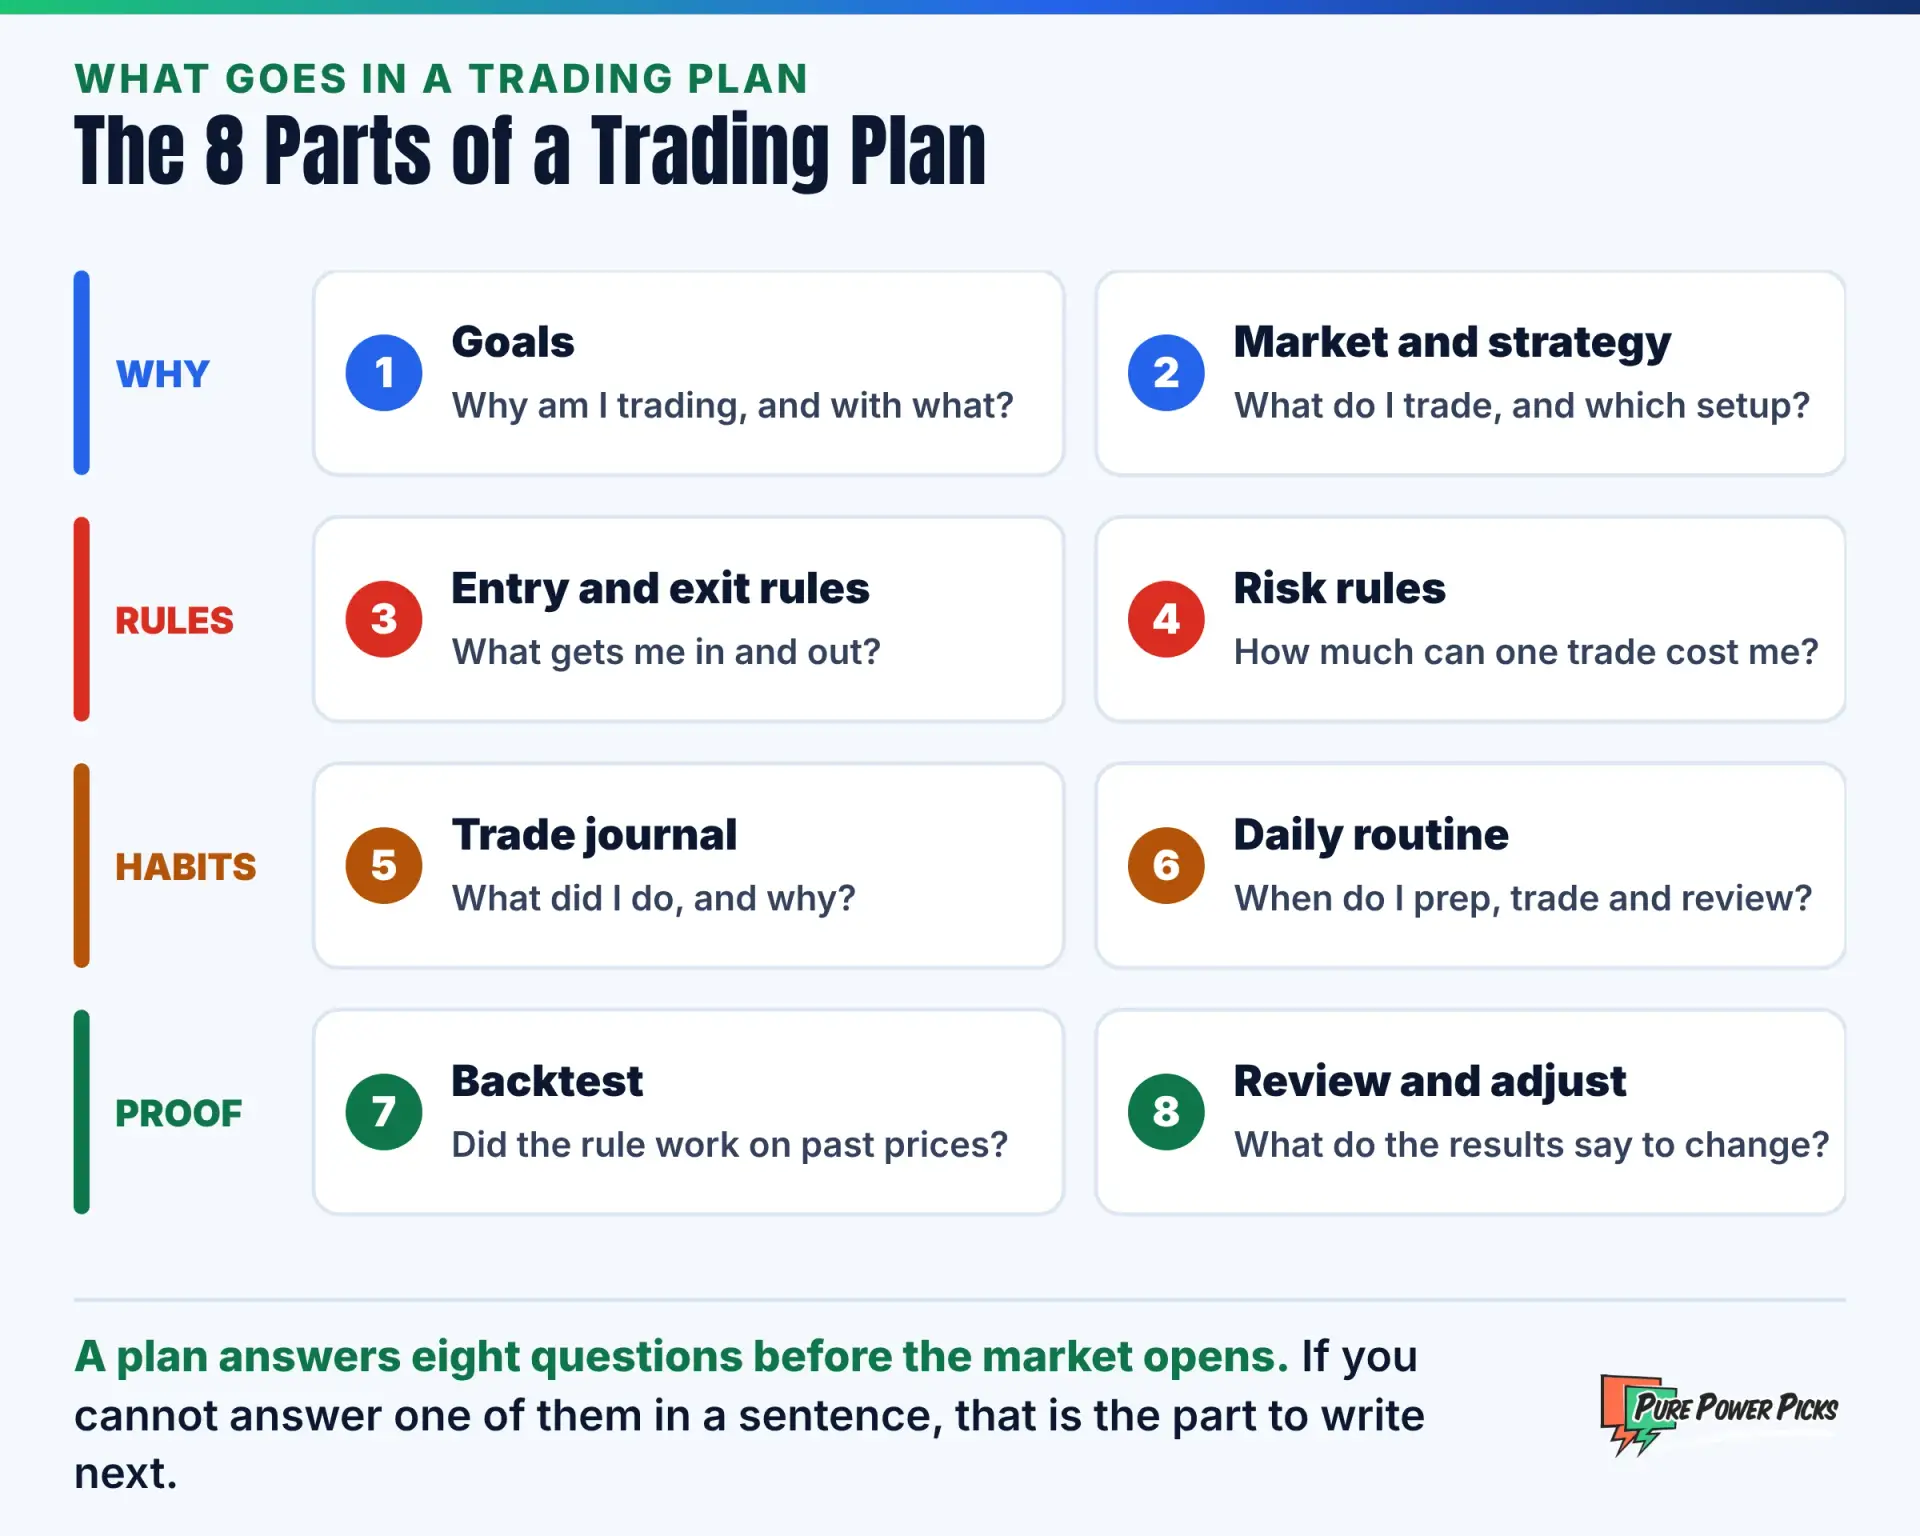
A complete plan answers eight questions. The first two cover why and what you trade. The next two are the rules. Then come the habits that keep you following the rules, and finally the proof that the rules are worth following.
A trading plan is also different from a trade plan. The trading plan is the standing rulebook. A trade plan is the one-off version for a single position: this ticker, this entry, this stop, this target, this size. Every trade plan should trace back to a rule in the trading plan.
Why Every Trader Needs a Plan
Trading without a plan is like skydiving without a parachute. Here is why a trading plan is essential:
- It takes emotion out of the decision: the stop and the target are set before the trade, when fear and greed are not in the room. Our guide to controlling emotions in trading covers the habits that help.
- It improves consistency: if every trade follows the same rules, a string of results tells you something about the rules. If every trade is improvised, it tells you nothing.
- It helps manage risk: you define what one trade, one day and one week can cost before you place an order.
- It allows for review and optimization: a written rule can be tested, measured and improved. A feeling cannot.
- It enforces discipline: a plan is a contract with yourself. Breaking it should feel like breaking a rule, not like using judgment.
FINRA makes a similar point in its investor education material: know your goals, your time horizon and how much risk you can take before you put money to work.
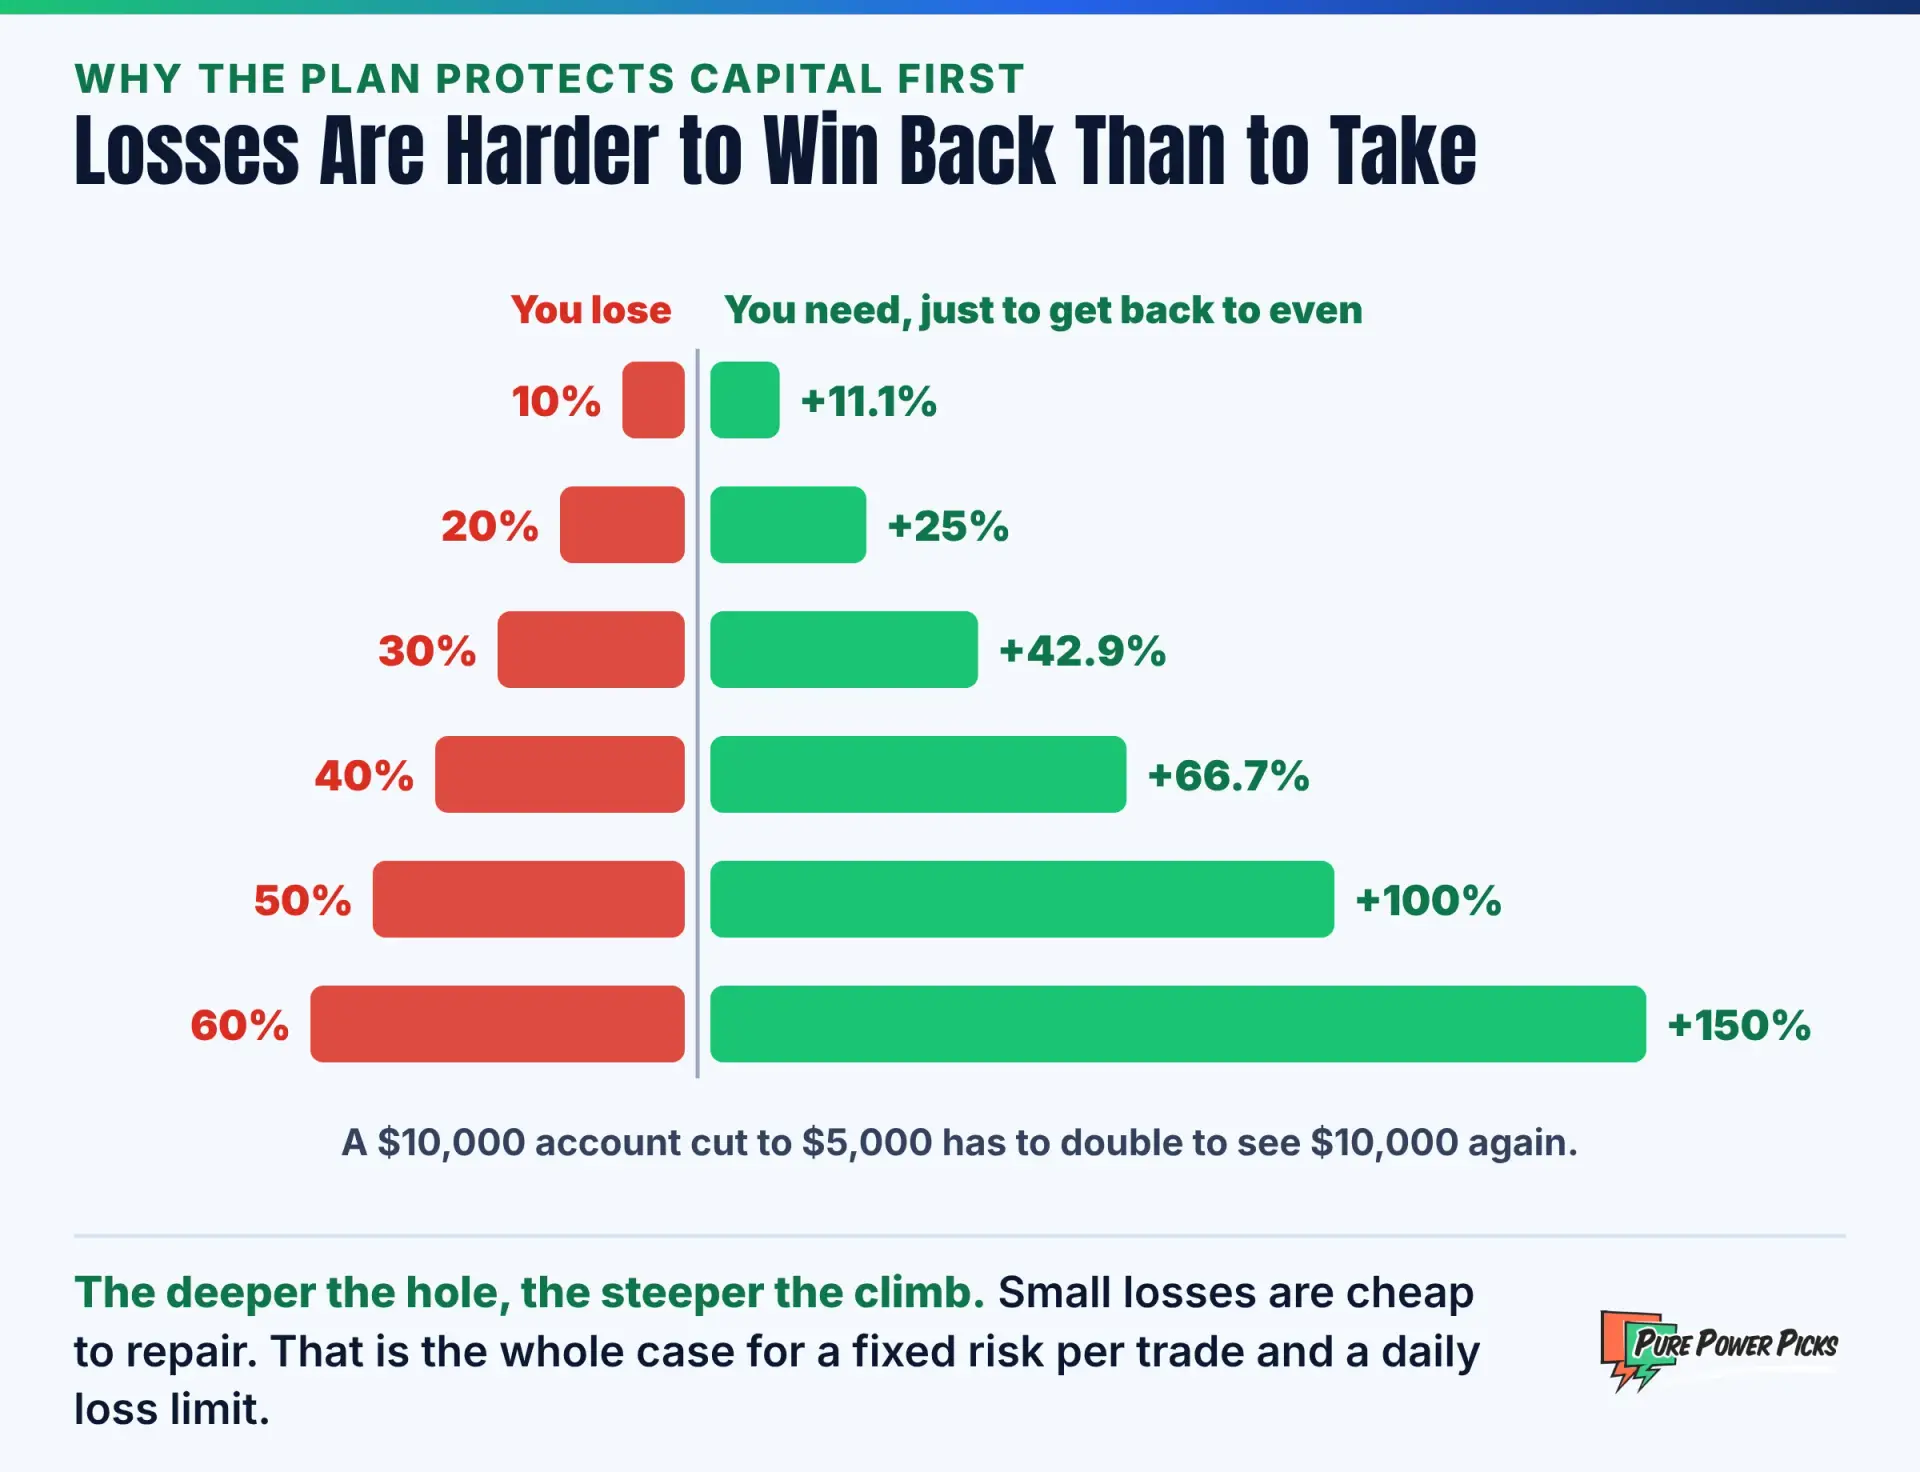
The strongest argument for a plan is arithmetic. Losses and gains are not symmetric. Lose 10% and you need 11.1% to get back to even. Lose 50% and you need 100%. A plan that keeps losses small keeps the recovery small too.
Step-by-Step: How to Build a Winning Trading Plan
Work through these eight steps in order and write one or two sentences for each. A first draft that fits on one page beats a perfect plan you never finish.
1. Define Your Trading Goals
Start with why you are trading and what you have to work with. Ask yourself:
- Are you trading for income, long-term growth, or side income?
- How much capital can you commit, and can you afford to lose it?
- What is your risk tolerance? Picture a 10% drawdown in dollars, not percent.
- Are you available to trade during the day or only after hours?
Then set goals you control. “Make $2,000 a month” depends on the market. “Follow my rules on every trade this month” and “risk no more than 1% per trade” depend only on you. Process goals like these are the ones worth writing down, because they are the ones you can hit on purpose.
Your schedule shapes your style. Day trading needs you at the screen during market hours, and FINRA warns that frequent intraday trading carries extra risks, particularly on margin. Swing trading, where positions last days to weeks, fits around a job. Our comparison of options trading vs day trading can help you choose.
2. Choose Your Market and Strategy
Pick the markets and setups you will focus on:
- Stock trading: the simplest place to start, because the only moving part is price.
- Options trading: adds leverage, time decay and volatility, so the plan needs rules for each.
- Crypto trading: trades around the clock, which makes a daily loss limit and set hours even more important.
Then narrow it to one or two setups you can describe in a sentence, such as a breakout above resistance on heavy volume or a pullback to a rising moving average. One setup traded a hundred times teaches you more than ten setups traded ten times each. For ideas, see our guides to the top trading setups for swing traders and to how to spot buy and sell signals.
Use tools like TradingView or communities like The Chart Guys to refine your strategy and monitor setups.
3. Set Clear Entry and Exit Rules
Your plan should clearly define, for each setup:
- Entry signals and confirmation indicators: the exact condition that gets you in, and what has to agree with it.
- Stop-loss levels based on technical structure: a price that proves the idea wrong, such as the prior low.
- Profit-taking rules and exit conditions: a target, a trailing rule, or a time limit.
- Setup invalidation criteria: what cancels the trade before you ever enter.
Write each rule as an if-then statement so there is nothing to interpret in the moment. For example: if price closes above its 50 day high on at least twice its average volume, then I buy at the close. If price trades below the prior low, then I sell. If price reaches twice my risk, then I sell.
Here is that exact rule on two real charts. Apple closed at $207.15 on June 11, 2024, above its highest close of the prior 50 days, on 3.2 times its average volume. The rule put the stop at $192.15 and the target at $237.15, and Apple reached the target on July 15. Nvidia triggered the same rule on August 27, 2026 at $227.98, with the stop at $209.23. It fell through the stop on September 14.
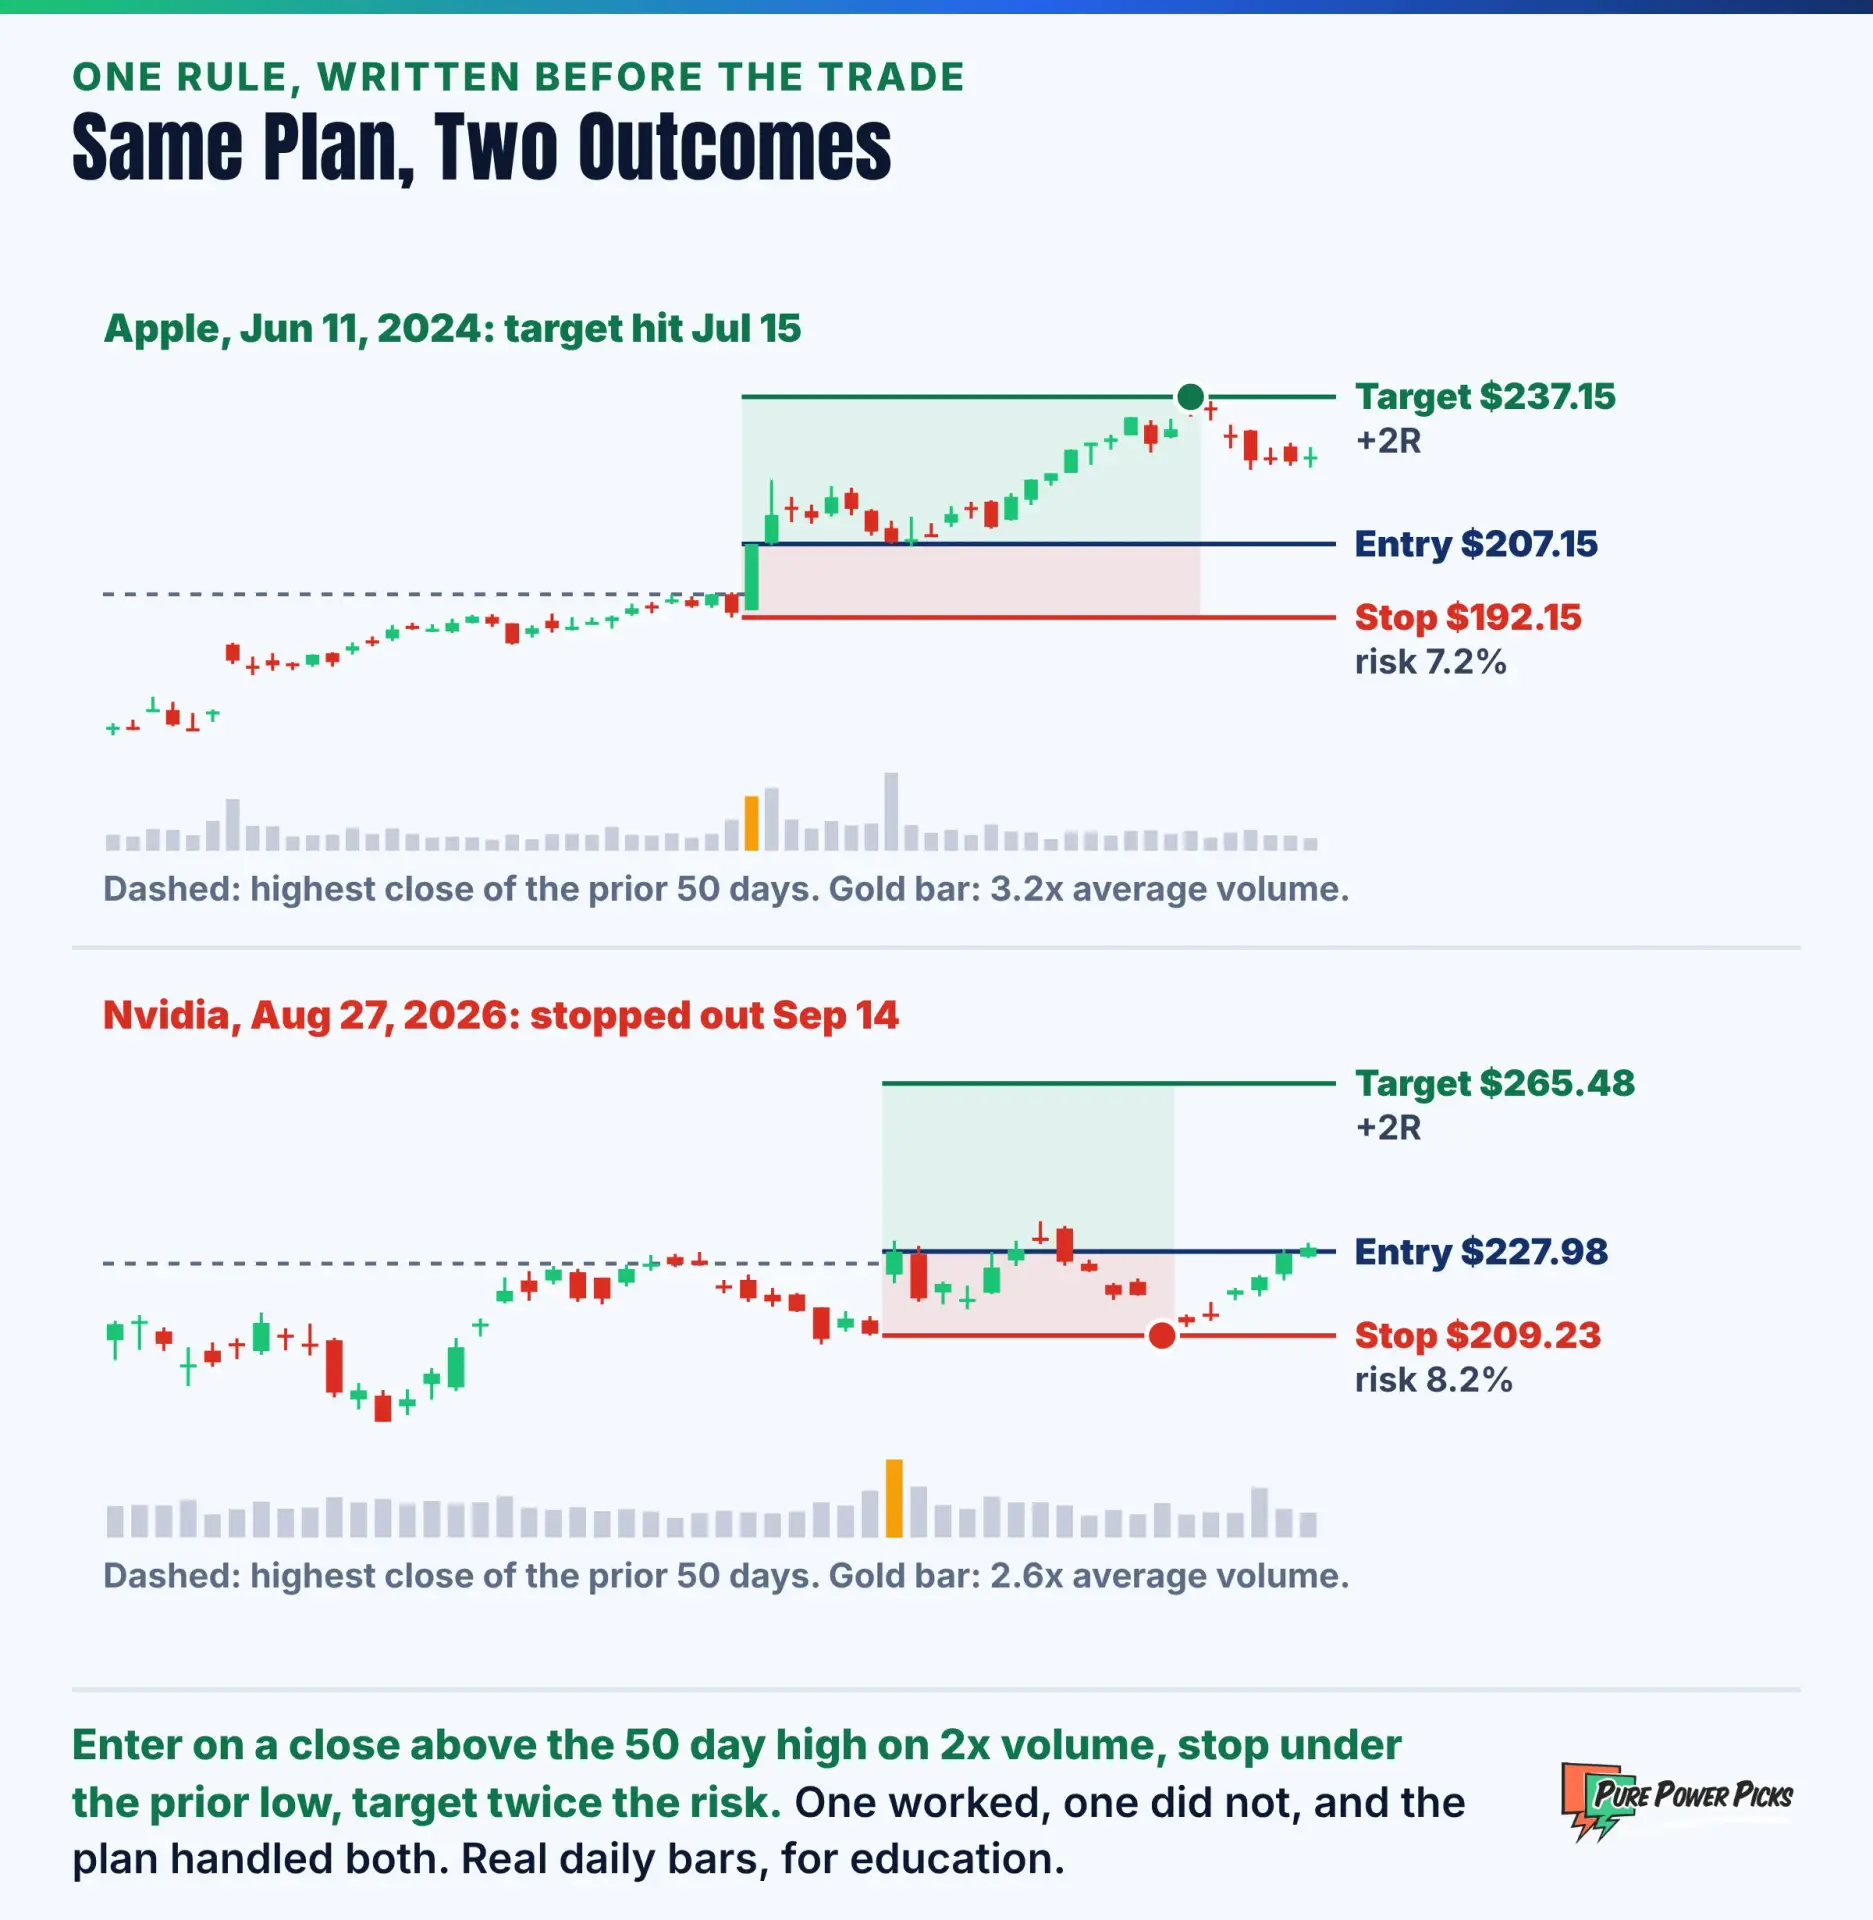
Neither outcome was knowable at the entry. What the plan did was fix the cost of being wrong before either trade started. For more on placing exits, see our guides to the pros and cons of stop losses and the risk-reward ratio.
4. Determine Your Risk Management Rules
- Risk per trade: max 1% to 2% of the account.
- Position sizing: let the stop set the size, as in the example below. Our guide to position sizing for options covers the options version.
- Daily loss limits: define when to stop trading, for example after three losing trades or a 3% loss on the day.
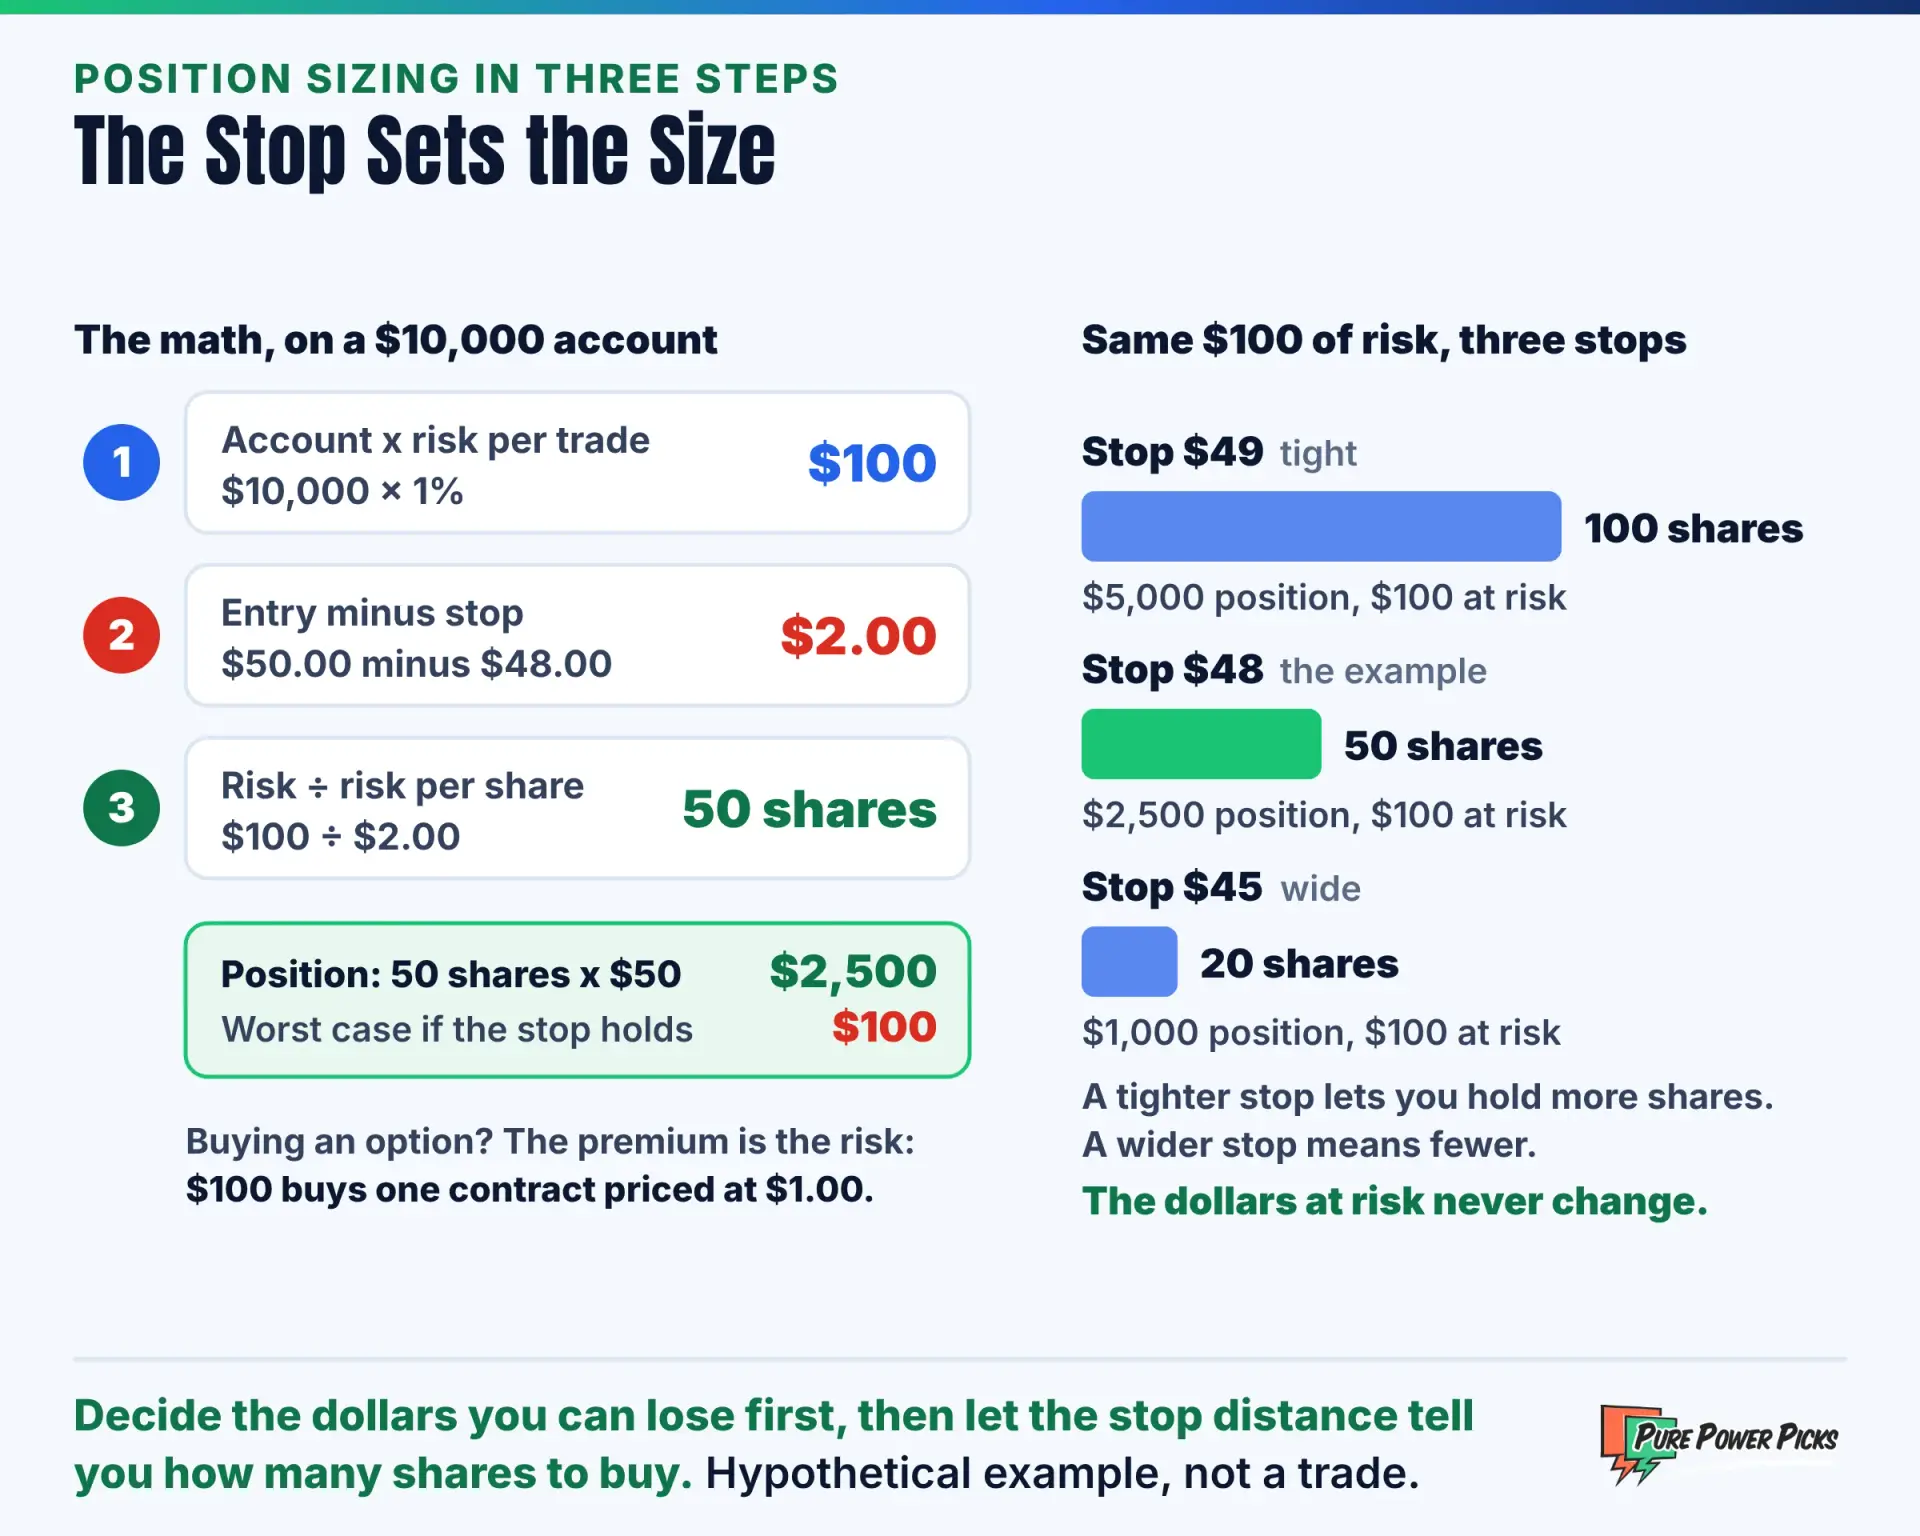
Position size comes from the stop, not from how good the trade feels. Take the dollars you are willing to lose, divide by the distance from your entry to your stop, and that is your share count. On a $10,000 account risking 1%, with an entry at $50 and a stop at $48, that is $100 ÷ $2 = 50 shares.
Apply it to the two charts above. On the Apple trade the stop was $15.00 below the entry, so $100 of risk buys 6 shares. On the Nvidia trade the stop was $18.75 away, so 5 shares, and the loss when the stop was hit was about $94. That is a full-size loss, and it is less than 1% of the account.
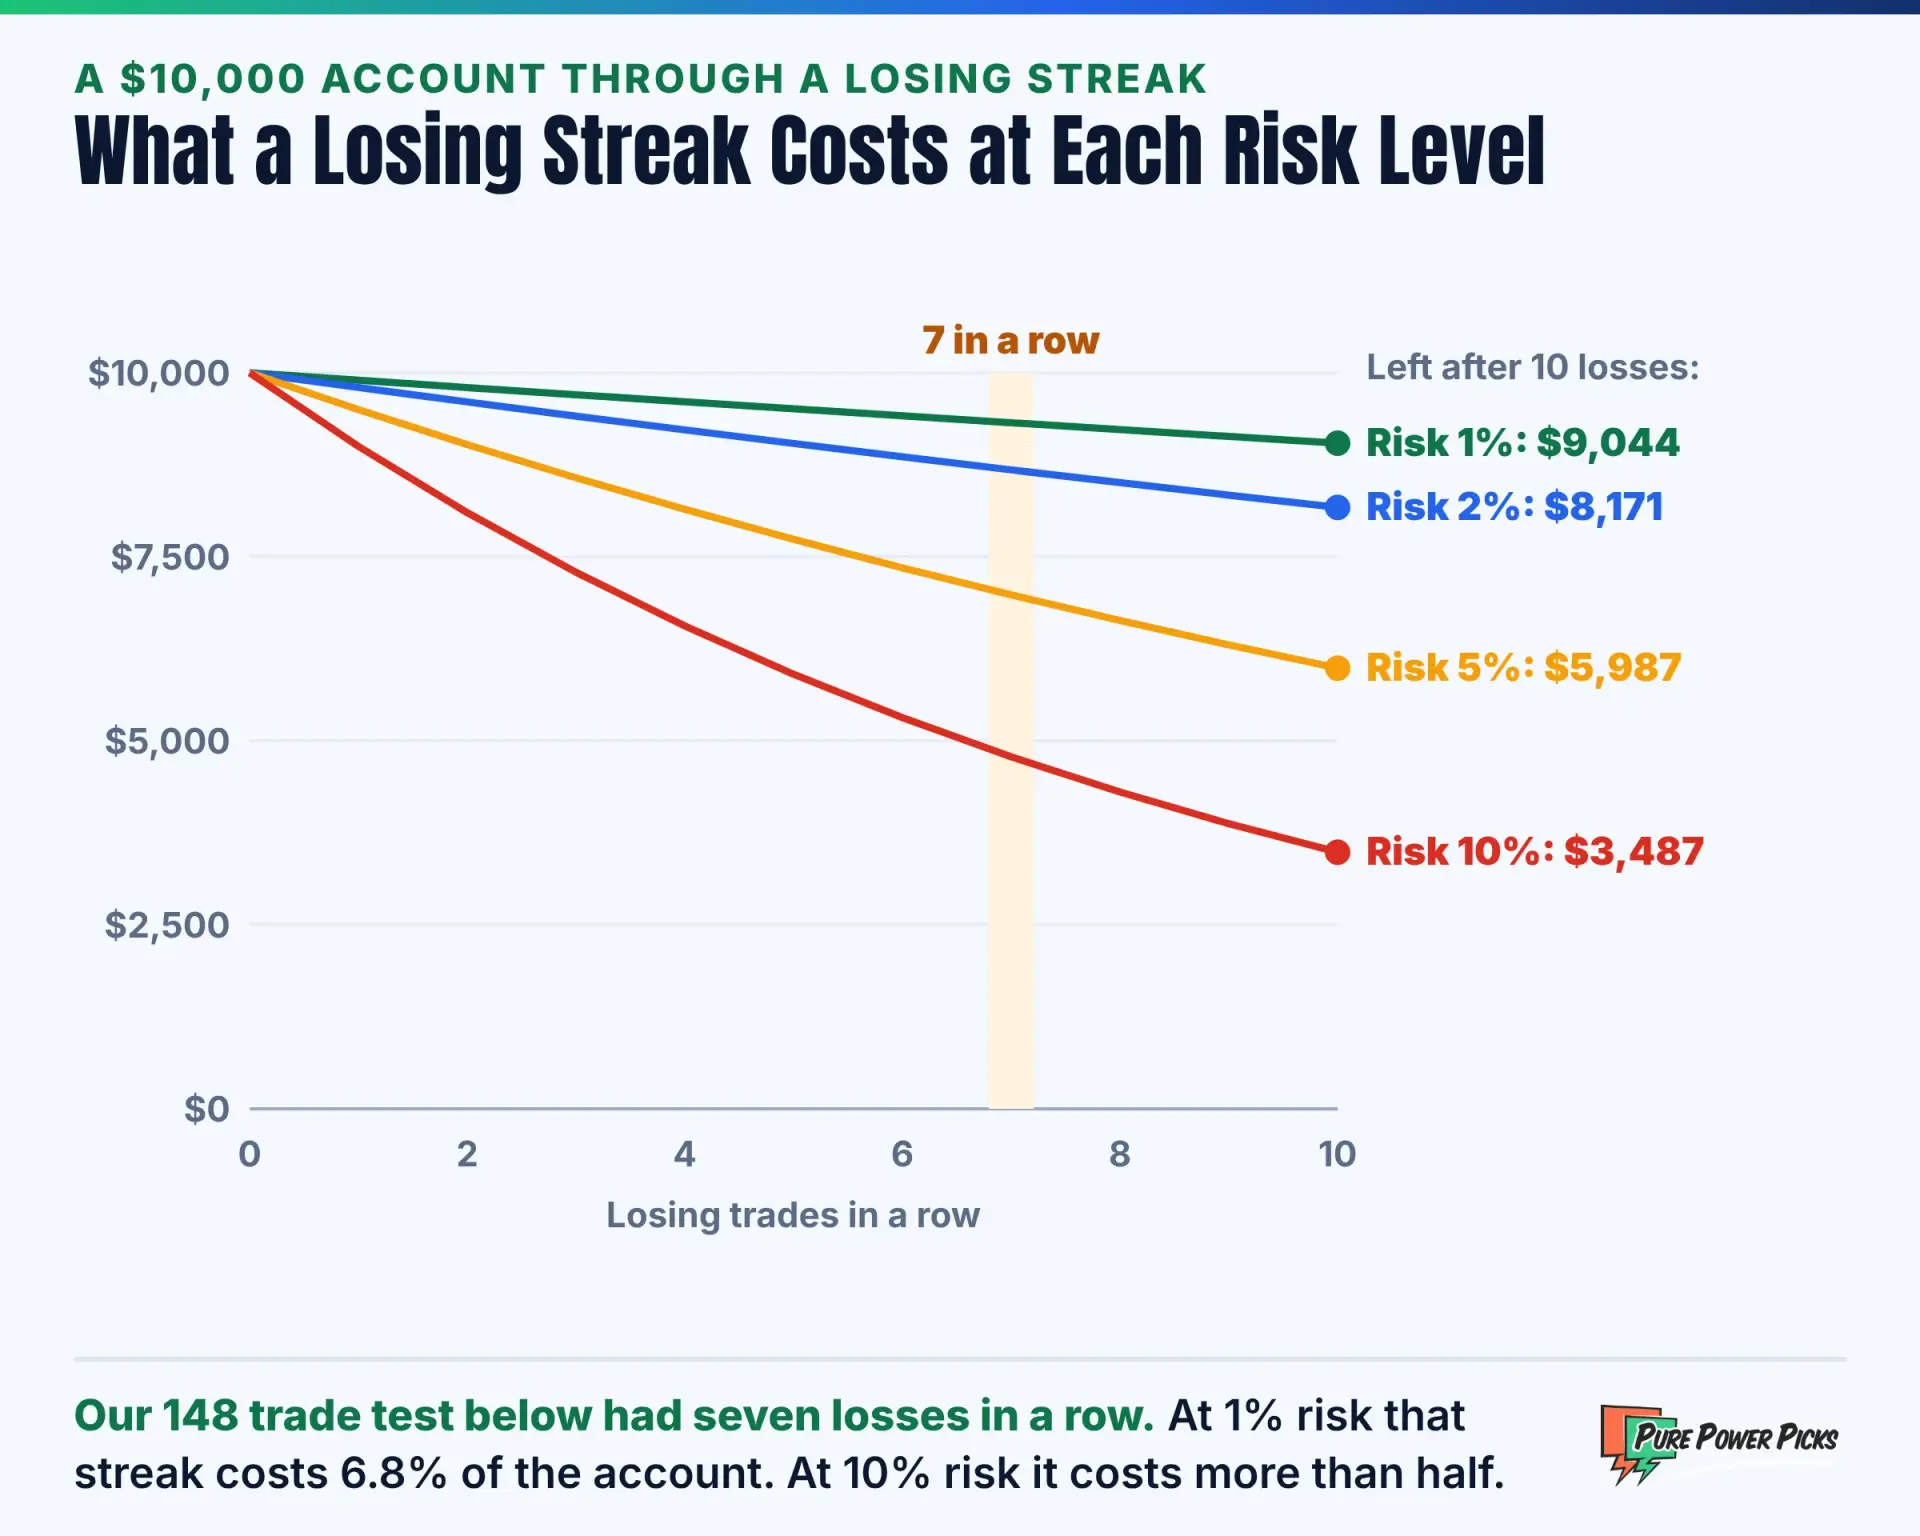
Why so small? Because losing streaks are normal, even for a rule that works. Ten losses in a row at 1% risk leaves a $10,000 account at $9,044. The same streak at 10% risk leaves $3,487.
See this Fidelity risk management guide for more details, and our own options trading risk management rules.
The last number to know is expectancy: what the plan makes or loses per trade, on average. It combines your win rate with the size of your wins and losses. Measure everything in R, where 1R is the amount you risk on one trade. A plan that wins 40% of the time, making 2R on winners and losing 1R on losers, earns 0.20R per trade. A plan that wins 60% of the time but takes 0.5R winners against 1R losers gives up 0.10R per trade.
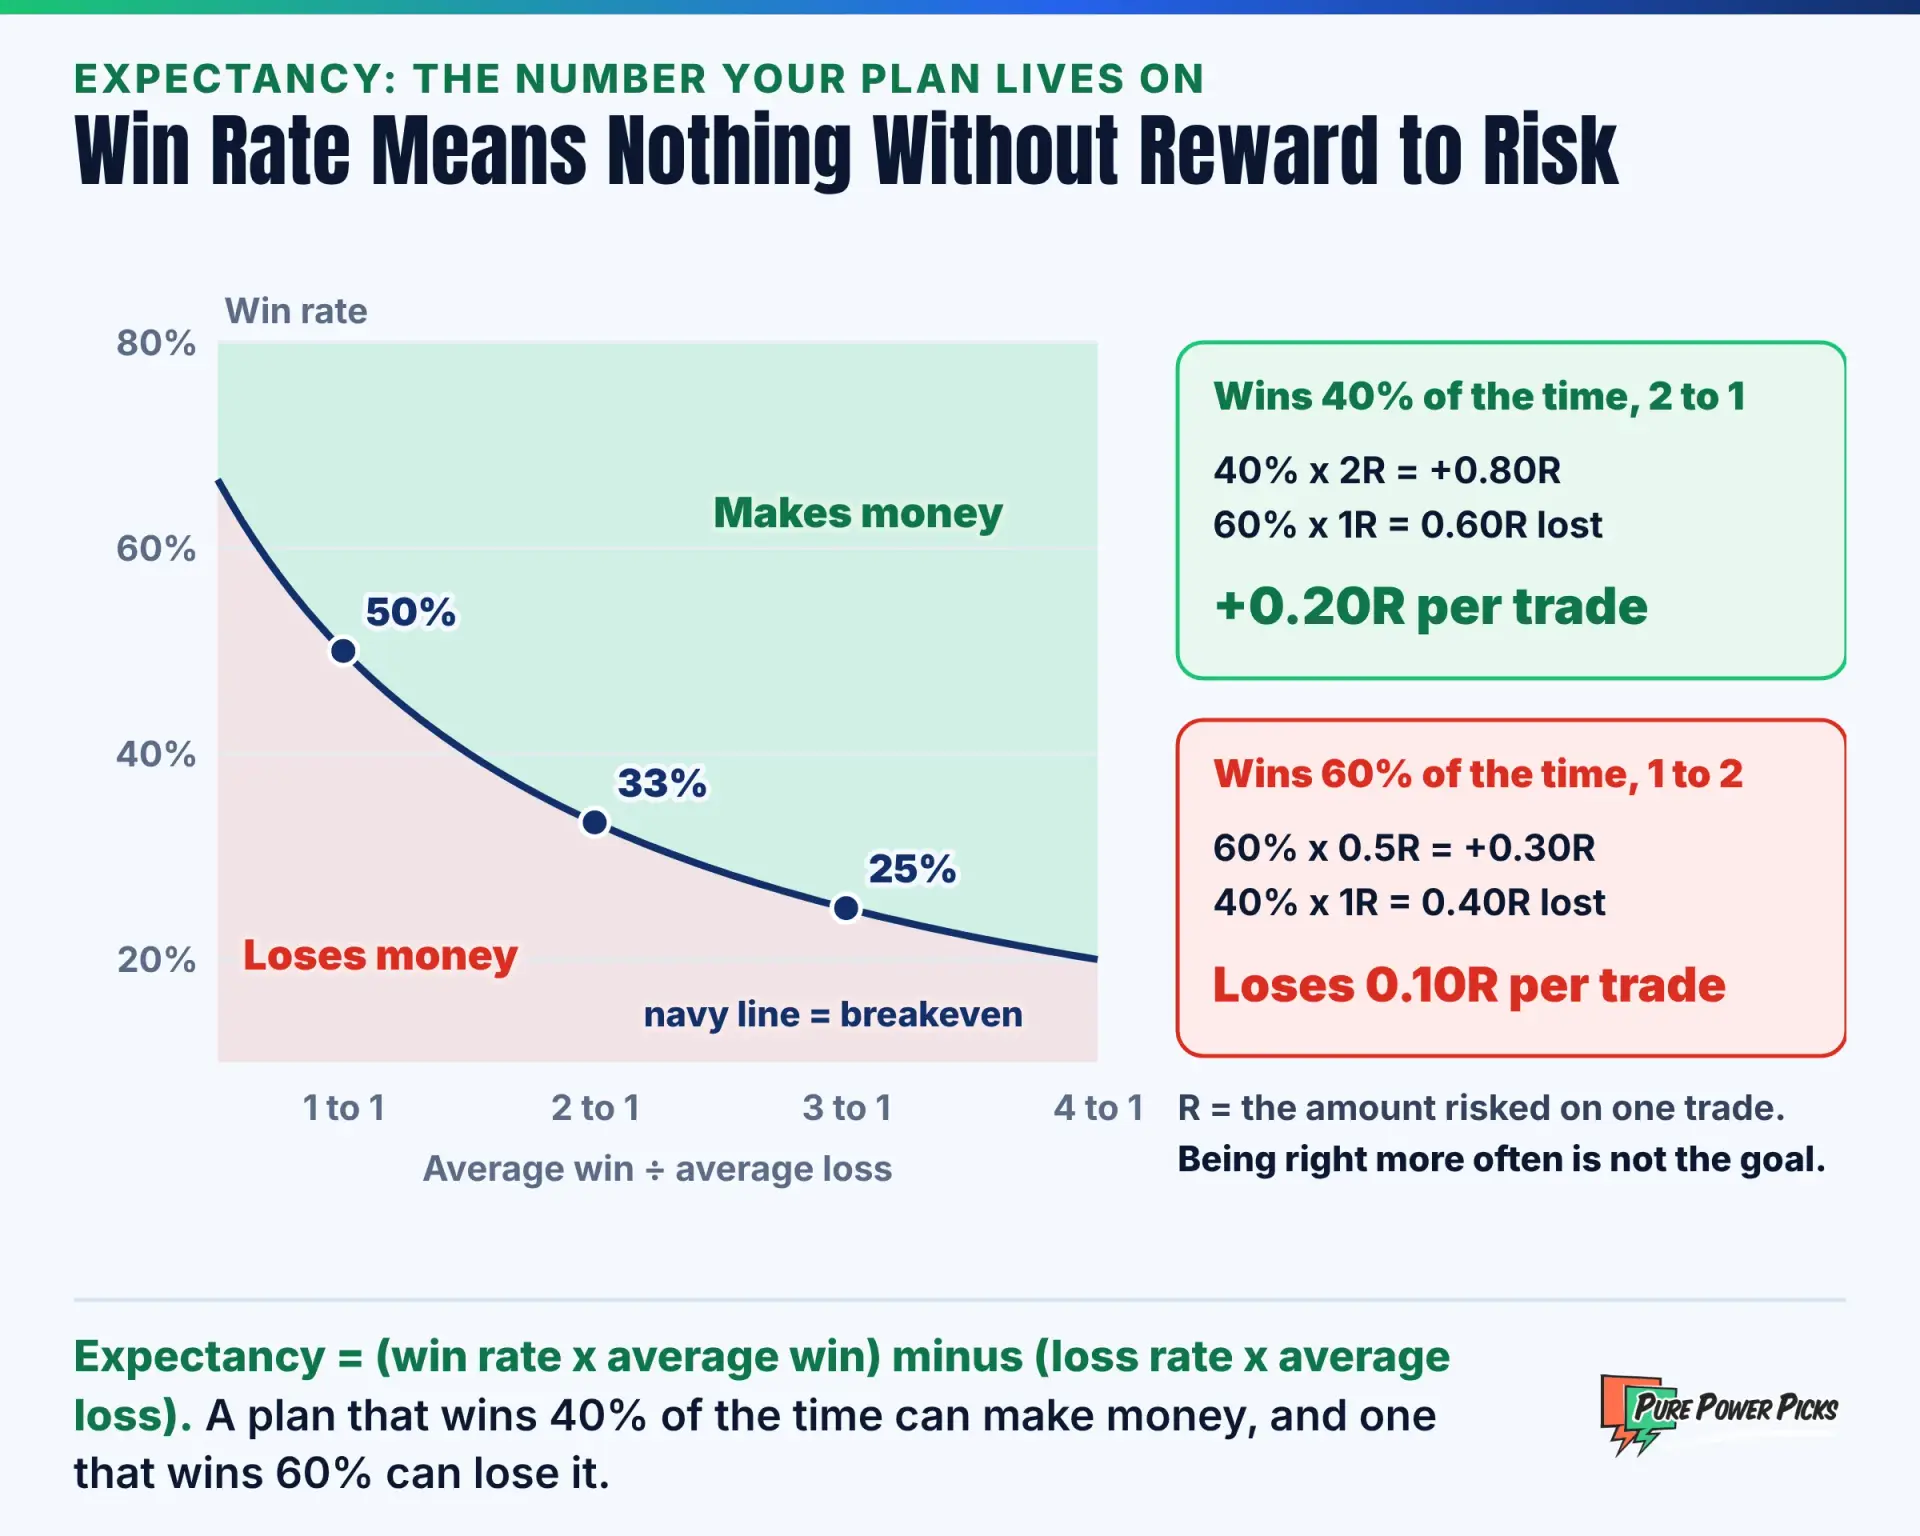
That is why a high win rate is not the goal. Our guide to win rate vs risk reward goes deeper on the trade-off.
5. Create a Trade Journal
Log and review:
- Entry/exit prices
- Trade reasoning: which rule triggered the trade
- P&L outcomes, in dollars and in R
- Emotions and mistakes
- Whether you followed the plan, yes or no
That last line matters most. A journal splits your results into two piles: trades that followed the plan and trades that did not. If the rule-following trades make money and the others lose it, the fix is discipline. If the rule-following trades lose, the fix is the rules.
Great tools: TraderVue, Edgewonk. Our roundup of the best trading journals compares free and paid options, and what is a trading journal explains what to track.
Prefer to own your journal outright? Grab our free trading journal template for Google Sheets, Excel and Notion, with auto win rate, R-multiples, expectancy, an equity curve, a discipline score, and a dedicated options tab.
6. Define Your Trading Routine
Establish a daily workflow such as this one. Times are Eastern, and the regular session runs from 9:30 AM to 4:00 PM:
- 8:00 AM: pre-market news scan
- 9:00 AM: watchlist prep, with levels and alerts set
- 4:15 PM: post-trade journaling
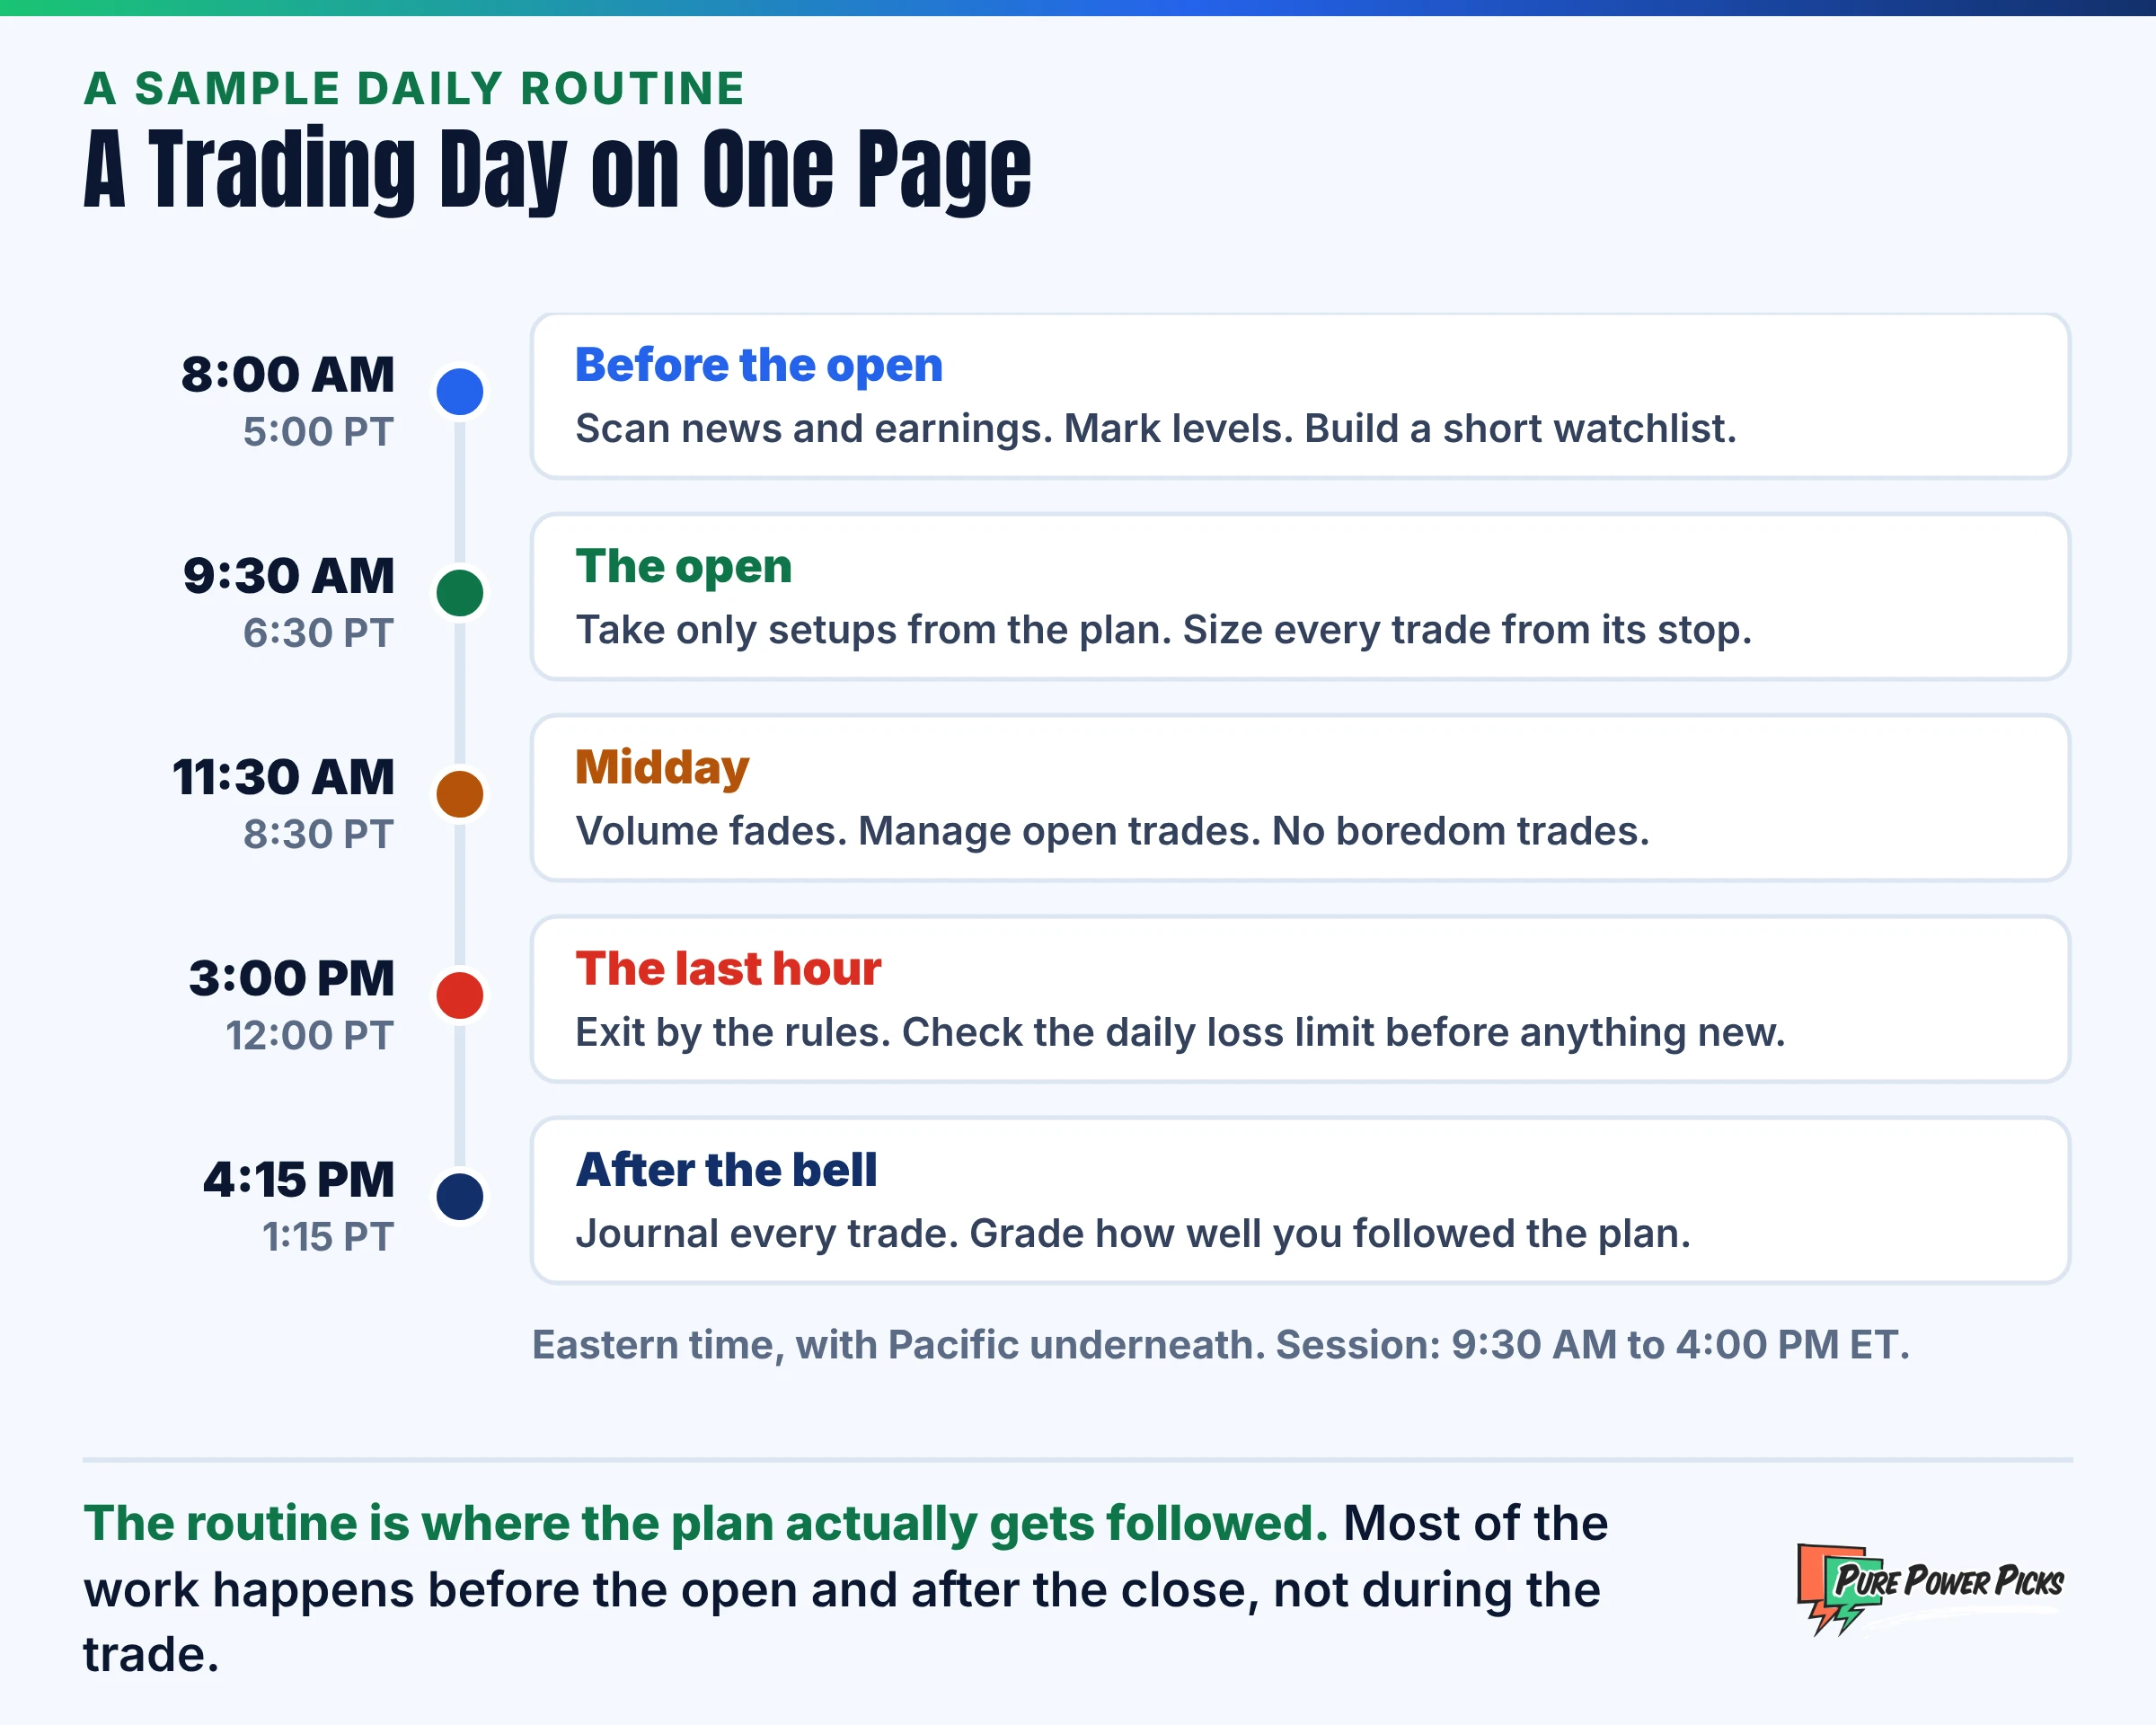
Add a weekly slot too: thirty minutes on the weekend to read back through the journal and build next week’s watchlist.
7. Backtest and Simulate Your Plan
Before going live, backtest your strategy on past prices, then trade it on paper, with tools like:
- TradingSim
- thinkorswim paperMoney (now part of Schwab)
- MetaTrader 5
To show what a backtest tells you, we ran one on the sample rule from the template below: buy a close above the highest close of the prior 50 days on at least twice the average volume, put the stop under the prior low, set the target at twice the risk, and exit after 40 trading days if neither is hit. We ran it on 40 large, well-known U.S. stocks from January 2024 through September 2026.
The rule produced 148 trades. 46 hit the target, 78 hit the stop, and 24 timed out with an average gain of 0.46R. That is a 31% win rate on targets, just under the 33% breakeven for a 2 to 1 rule, yet the rule still averaged +0.17R per trade because the timed-out trades were positive on balance. The longest losing streak was seven trades.
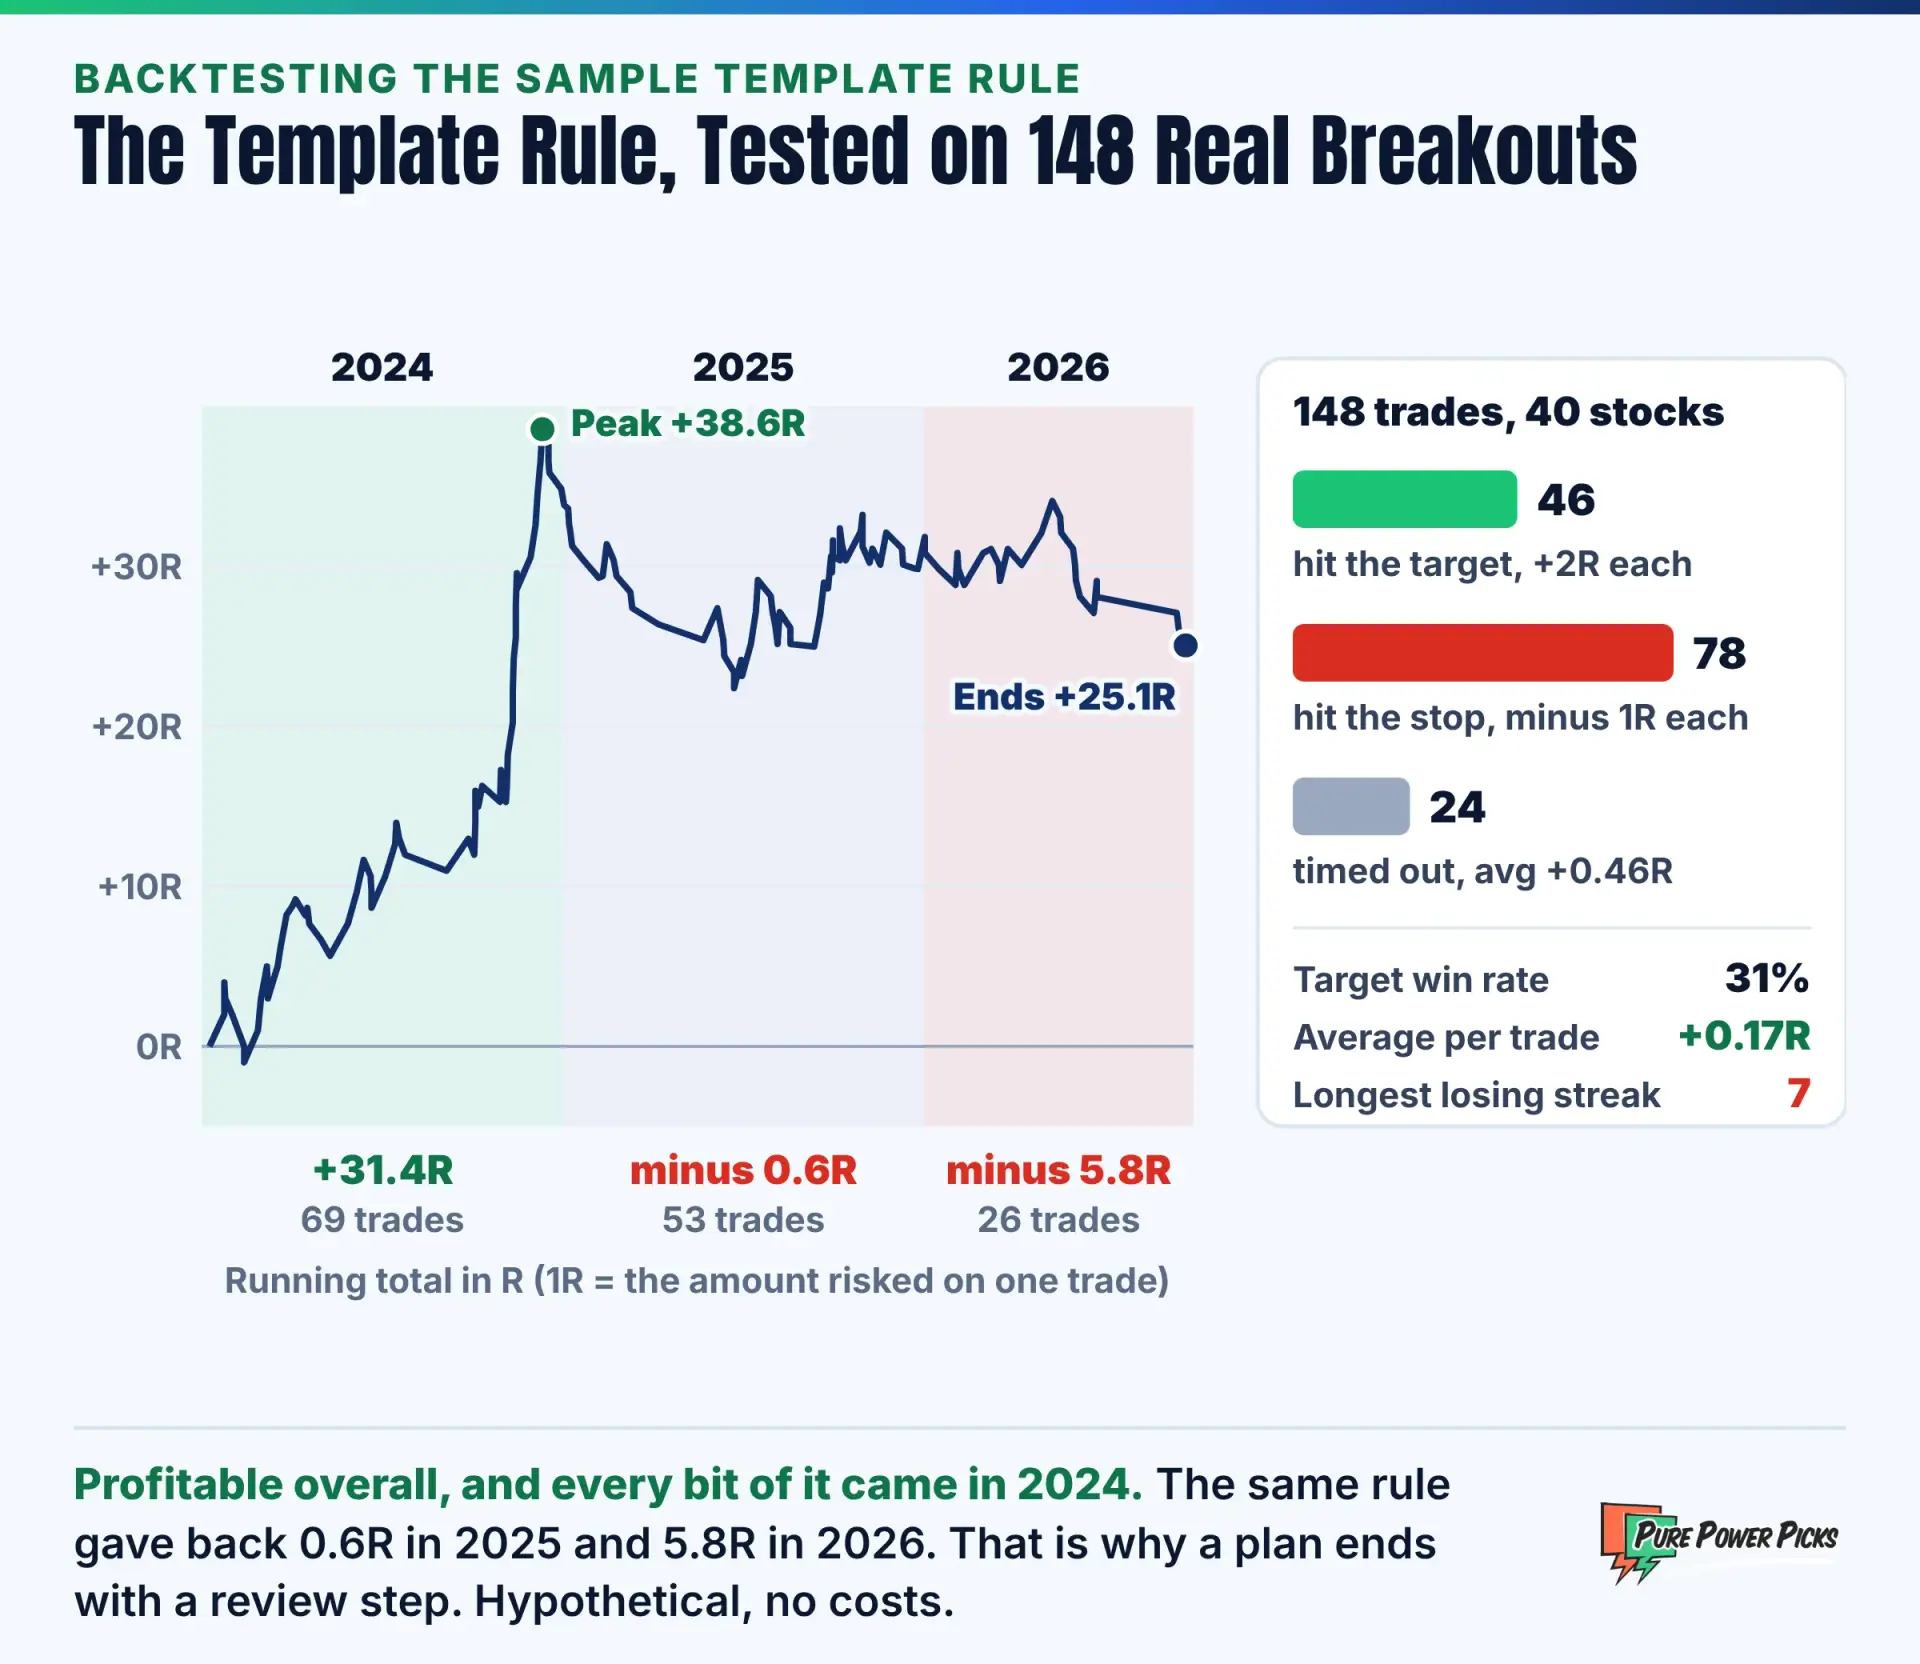
The year-by-year split is the real lesson. The rule made 31.4R in 2024, then lost 0.6R in 2025 and another 5.8R on trades opened in the first eight months of 2026. Someone who started trading it in January 2025 would have been down 6.4R twenty months later, with a rule that looked excellent on paper. A backtest tells you what to expect, including how long the dry spells can last.
A backtest is not a forecast. This one ignores commissions and slippage, assumes every entry fills at the closing price, and uses stocks picked with hindsight. All three flatter the result. Past performance does not guarantee future results. Treat a backtest as a way to learn how a rule behaves, never as a promise of what it will earn.
After the backtest, paper trade the rule for a few weeks to practice the routine, then go live at the smallest size you can.
8. Review and Adjust Your Plan
Review your performance monthly. Ask:
- Am I meeting my targets, starting with the process ones?
- Which strategies are working?
- Should I adjust risk or refine entries?
Change one thing at a time, and only on evidence from a meaningful number of trades. Twenty trades is a hint. A hundred is a pattern. And never change a rule in the middle of a trade: the review happens on the weekend, with the journal open and the market closed.
Give every plan a version number and a date. When you change a rule, write down what changed and why. Six months later you will be able to see whether the change helped, instead of guessing.
Bonus: Sample Trading Plan Template
Copy this and replace the examples with your own rules. The strategy shown is the one tested above. It is an illustration, not a recommendation.
Common Mistakes to Avoid
- Trading without a stop-loss: if you do not know where you are wrong, you cannot size the trade.
- Overtrading due to emotion: a daily loss limit and a cap on trades per day end the session before frustration does. See our guide to trading psychology mistakes.
- Changing strategies mid-trade: moving a stop further away, or turning a short-term trade into a long-term hold, is a new and unplanned trade.
- Ignoring trade reviews and journaling: without the journal you repeat the same mistake under a different ticker.
- Judging the plan on a handful of trades: the rule we tested lost seven in a row and still finished ahead.
- Risking more after a loss to win it back: the size comes from the plan, never from the last result.
Final Thoughts
A trading plan is your business plan for the markets. Without one, every trade is a guess made under pressure. With one, each trade is a small, measured test of rules you chose with a clear head.
Write the first draft today and keep it to a page. Test it, trade it small, and review it every month. Stay consistent and refine over time.
Also check out:
- How to Spot Buy and Sell Signals
- Top Technical Indicators for Options Traders
- The Psychology of Trading: Mastering Emotions
Frequently Asked Questions
What should a trading plan include?
Eight parts: your goals, the market and setup you trade, entry and exit rules, risk rules such as risk per trade and a daily loss limit, a trade journal, a daily routine, a backtest of the rules, and a schedule for reviewing and adjusting the plan.
How much should I risk per trade?
A common rule is 1% to 2% of the account on any one trade. At 1%, ten losses in a row costs about 9.6% of the account. At 10%, the same streak costs about 65%. Smaller risk keeps a normal losing streak survivable.
What is a good win rate for a trading plan?
It depends on your reward to risk. A plan that makes twice what it risks breaks even at a 33% win rate, and one that makes three times its risk breaks even at 25%. Expectancy, the average result per trade, matters more than the win rate on its own.
How long should I backtest or paper trade before going live?
Long enough to see the rule through different market conditions and a losing streak. In our test, the same rule gained 31.4R in 2024 and lost ground in 2025 and 2026, so a single good year would have been misleading. Aim for at least 100 backtested trades, then a few weeks on paper.
How often should I change my trading plan?
Review it monthly, and change it only when a meaningful sample of trades points to a specific problem. Change one rule at a time and record the date, so you can measure whether the change helped.
Is a trading plan the same as a trading strategy?
No. A strategy is one part of the plan: the setup and its entry and exit rules. The plan also covers your goals, risk limits, position sizing, journal, routine and review process.
Want to See Entries, Stops and Targets on Real Setups?
Pure Power Picks is built education-first. Our alerts share chart setups with the alert price, the reasoning and the levels behind them, so you can measure each one against your own plan rather than follow blindly.
Explore Alert Plans
The PPP Team is the research and editorial team behind Pure Power Picks. We trade stocks and options and publish the work as we do it, with every alert tracked in public. Publishing since 2020. How we research and correct our work is written out in our editorial standards. Our content is strictly educational, never advice.
Disclaimer: The information provided by Pure Power Picks is for educational and informational purposes only and should not be considered financial, investment, or trading advice. We are not registered financial advisors. The examples in this article, including the backtest and the two charts built from historical prices, are hypothetical and are not actual trades or recommendations. Options trading involves substantial risk and is not suitable for all investors; you can lose more than your initial investment. Past performance, including any historical alert data, does not guarantee future results. Always do your own research and consult a licensed financial professional before making any investment decisions.