

Understanding the Risk-Reward Ratio in Stock and Options Trading
At Pure Power Picks, one of our core principles is trading smarter, not harder. A big part of that is understanding the risk-reward ratio: how much you stand to lose on a trade compared with how much you stand to make. Whether you are day trading stocks or swing trading options, that one comparison shapes your results more than almost any indicator.
This guide breaks down what the ratio is, how to calculate it, the win rate each ratio needs, and how it works for options. It also includes something most guides skip: we ran 1:1, 1:2 and 1:3 targets on the same 148 real trades to see what actually changes when you aim higher.
The risk-reward ratio tells you how often you need to be right. At 1:3, you break even by winning one trade in four. At 1:1, you need to win half. A good ratio does not make a trade work. It means your winners are large enough to pay for the losers you will certainly have.
| What it measures | Potential loss against potential gain on one trade |
| How to write it | Risk first: 1:3 means risk $1 to make $3 |
| Formula | Reward ÷ risk = (target minus entry) ÷ (entry minus stop) |
| Breakeven win rate | Risk ÷ (risk + reward): 25% at 1:3, 33% at 1:2, 50% at 1:1 |
| Common target | 1:2 or 1:3 for directional trades |
| Works with | Position sizing, stop placement and your actual win rate |
What Is the Risk-Reward Ratio?
The risk-reward ratio (often written R:R) measures how much potential reward you are aiming for on a trade compared with how much you are willing to risk. A 1:3 risk-reward ratio means you are risking $100 to potentially make $300. It applies the same way to stock and options trades.
Risk-reward ratio is the amount you can lose on a trade if your stop is hit, compared with the amount you can gain if your target is hit. Risk comes first in the ratio, so 1:3 means one unit of risk for three units of potential reward.
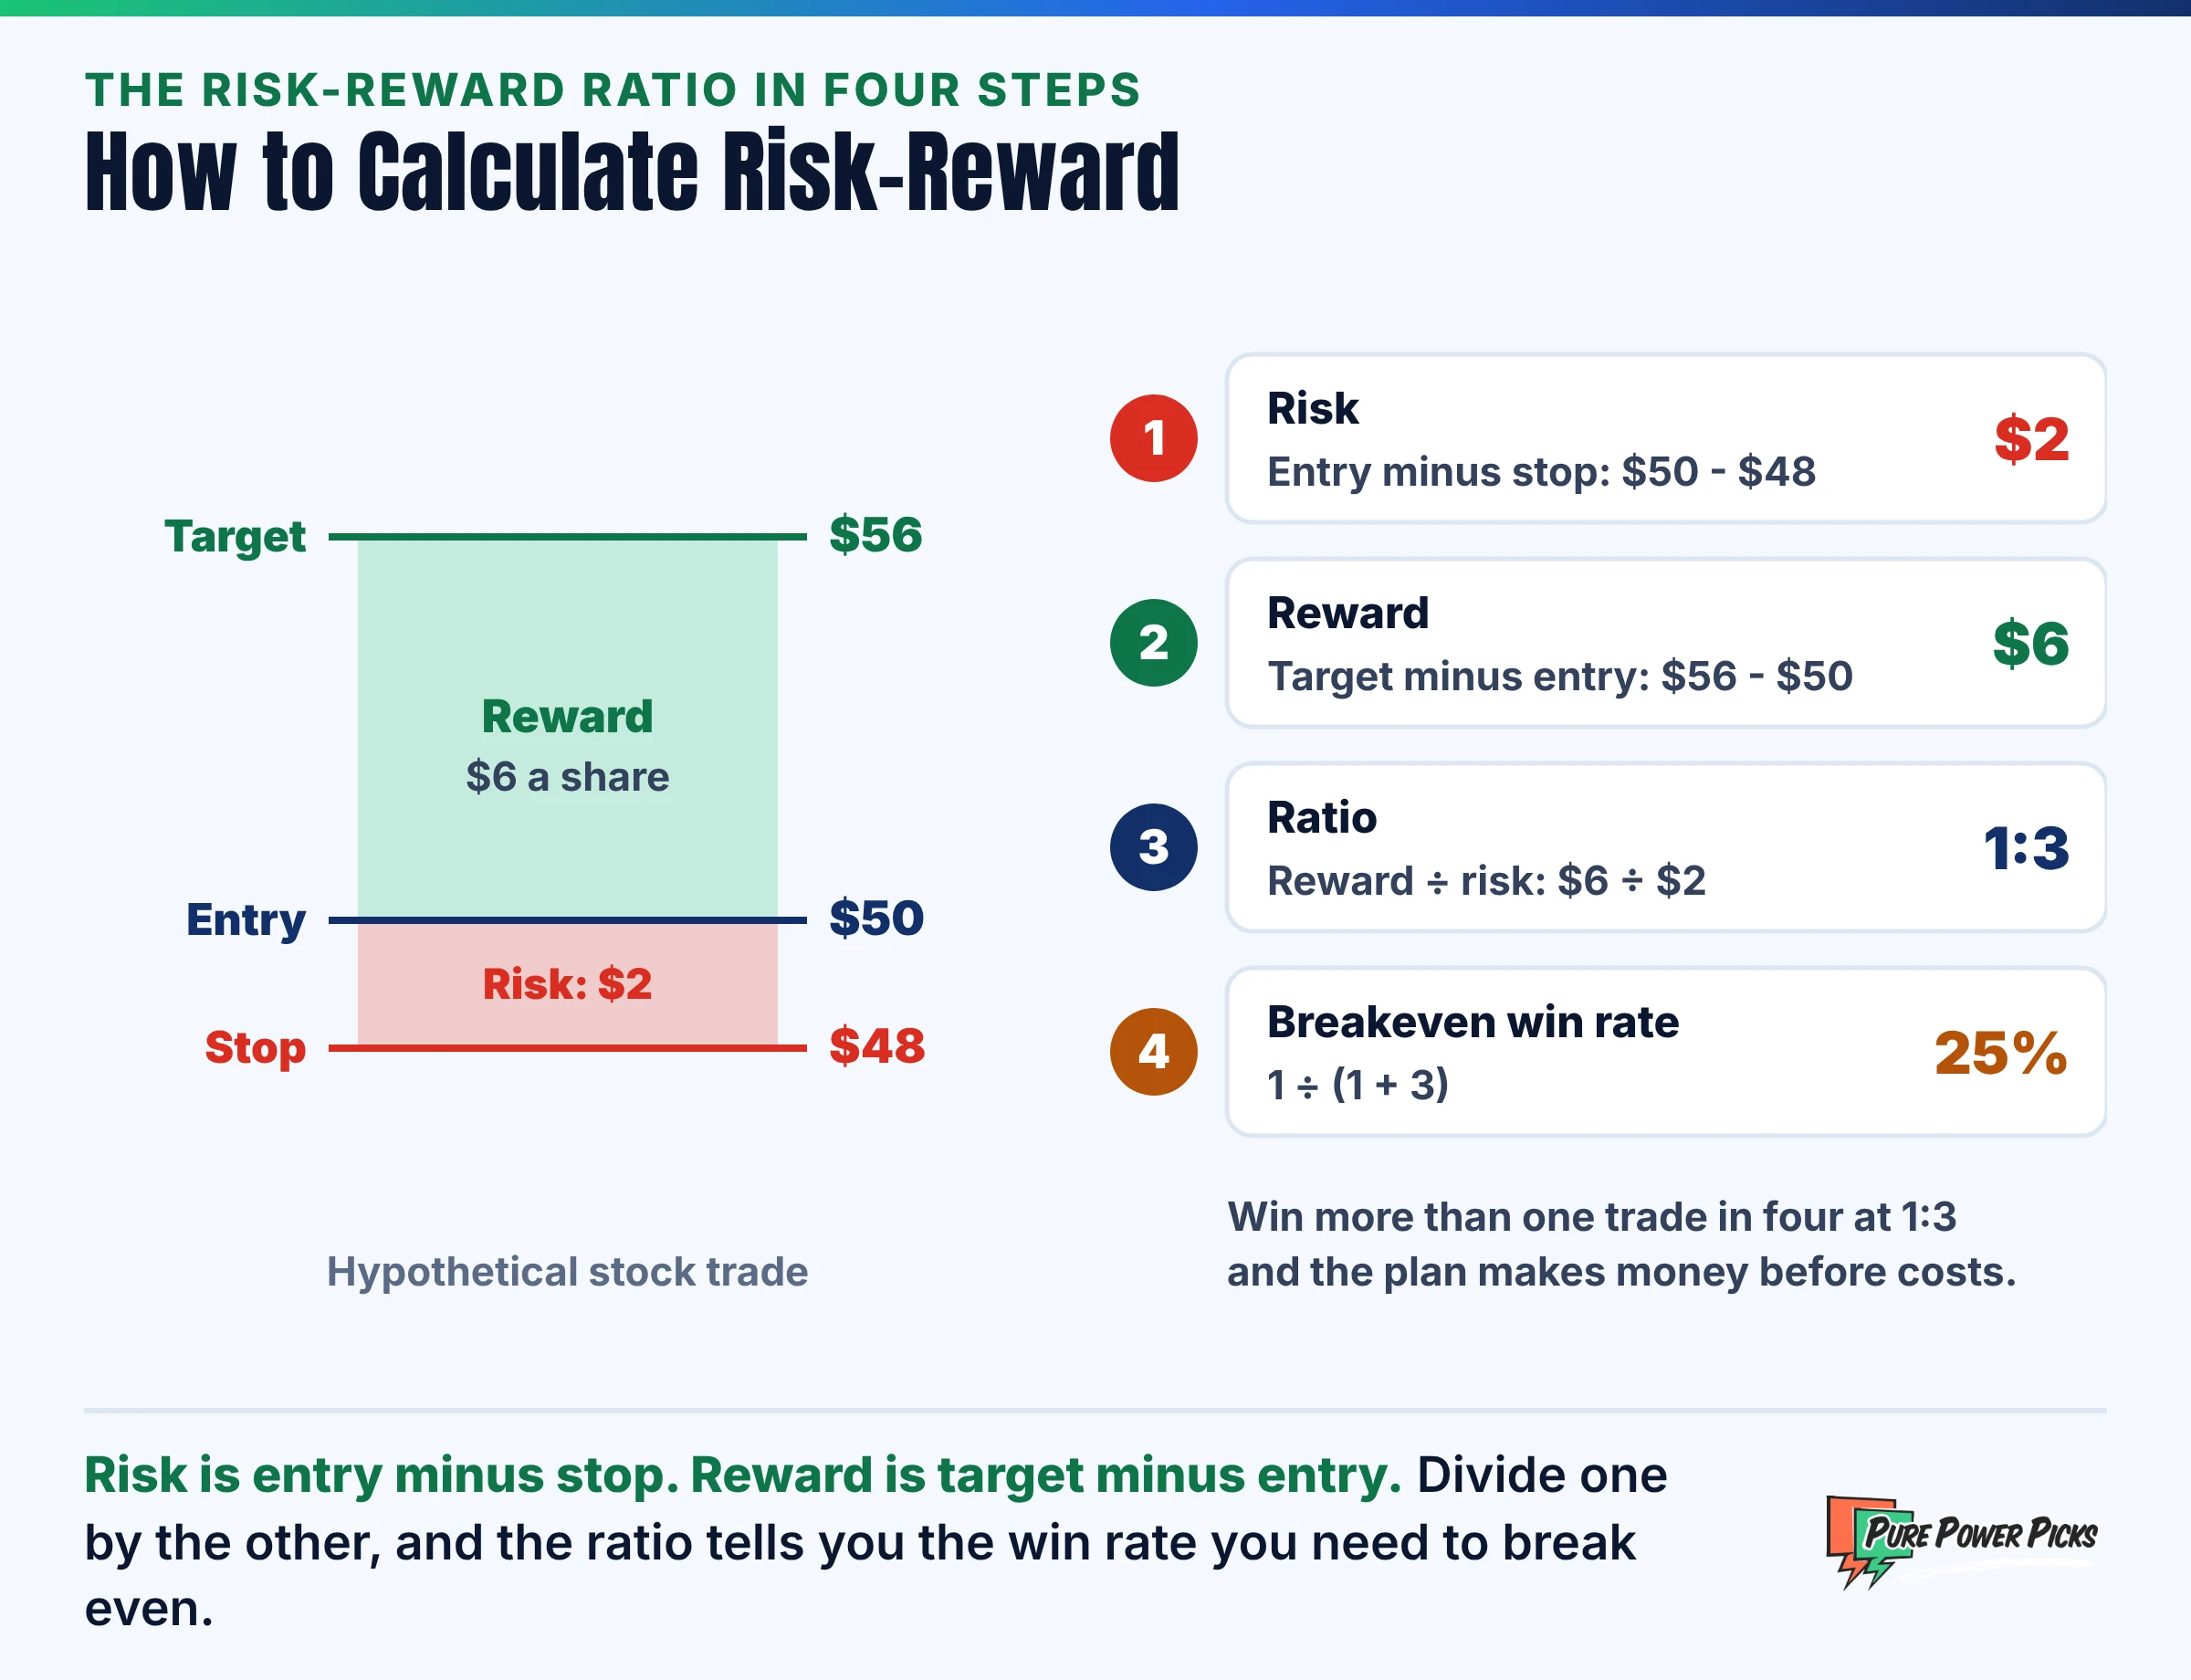
To calculate it, you need three prices: your entry, your stop and your target. Risk is the distance from entry to stop. Reward is the distance from entry to target. Divide reward by risk and you have the ratio.
Two notes on the way traders talk about it. Some people flip the order and say “3 to 1”, meaning reward to risk. It is the same trade. And many traders measure results in R, where 1R is the amount risked. A trade that hits a 1:3 target makes 3R. A trade that hits its stop loses 1R.
This concept is fundamental to position sizing, trade planning, and keeping your emotions in check, especially in fast-moving markets. When the exit prices are set before you enter, there is much less to decide under pressure.
Why the Risk-Reward Ratio Matters
Even traders with a win rate under 50% can be profitable if they target trades with high risk-reward setups. It is not about being right all the time. It is about making more when you are right than you lose when you are wrong.
Every ratio has a breakeven win rate: the share of trades you must win so that gains and losses cancel out. The formula is risk ÷ (risk + reward). At 1:3 that is 1 ÷ 4, or 25%. At 1:1 it is 50%. Flip the ratio so that you risk $3 to make $1, and you need to win 75% of the time just to stand still.
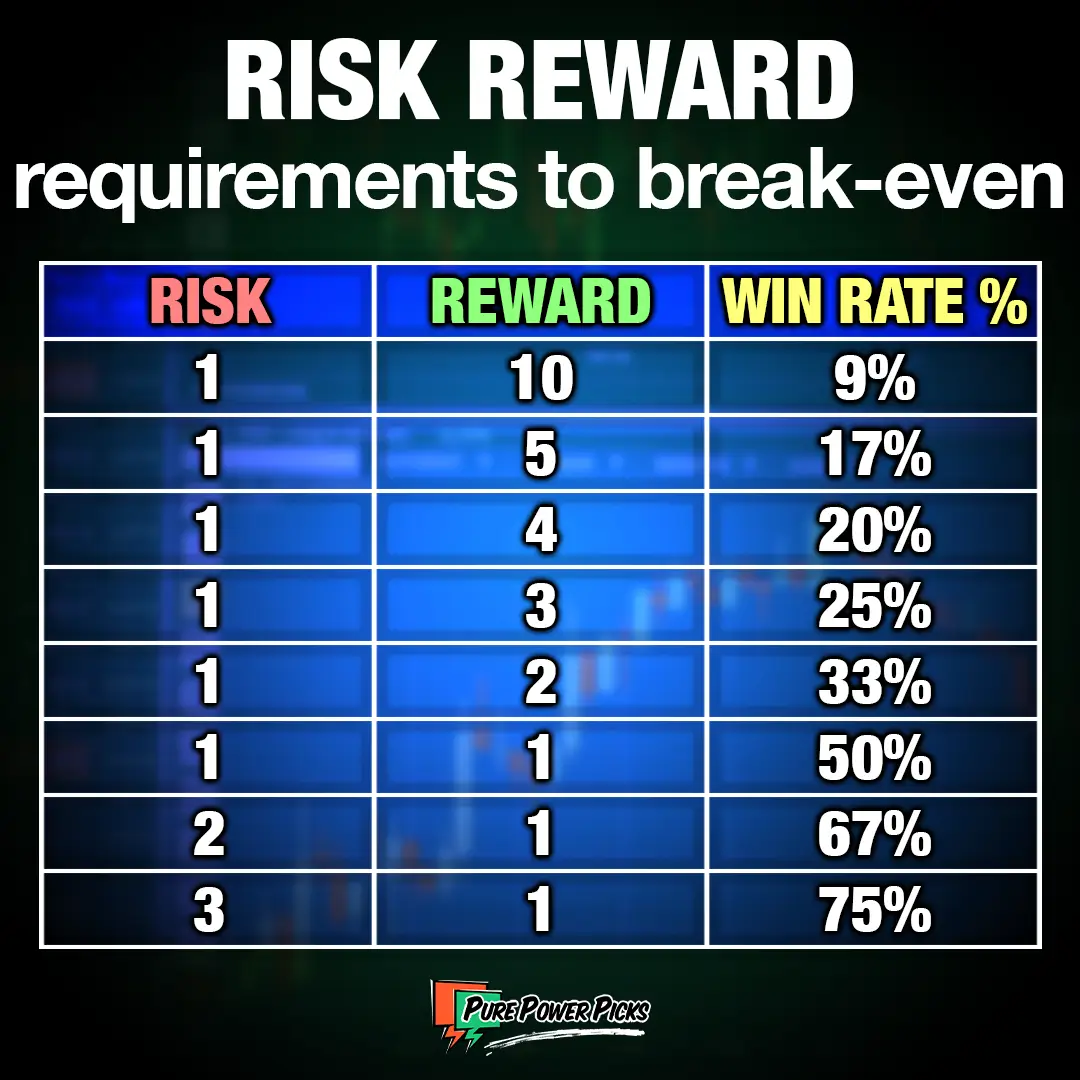
Read the table from the middle outward. Above 1:1, each step up in reward lowers the win rate you need: 33% at 1:2, 25% at 1:3, 20% at 1:4. Below it, the requirement climbs fast: 67% when you risk 2 to make 1, and 75% when you risk 3 to make 1. Your real win rate has to beat the number in the last column, with room to spare for costs. Our guide to win rate vs risk reward goes deeper on how the two fit together.
Visualizing Risk-Reward in Real Time
Seeing the concept in action makes it easier to grasp. Below is a graphical example of how different R:R setups look on a price chart. It includes key levels like stop loss, entry, and take-profit zones.
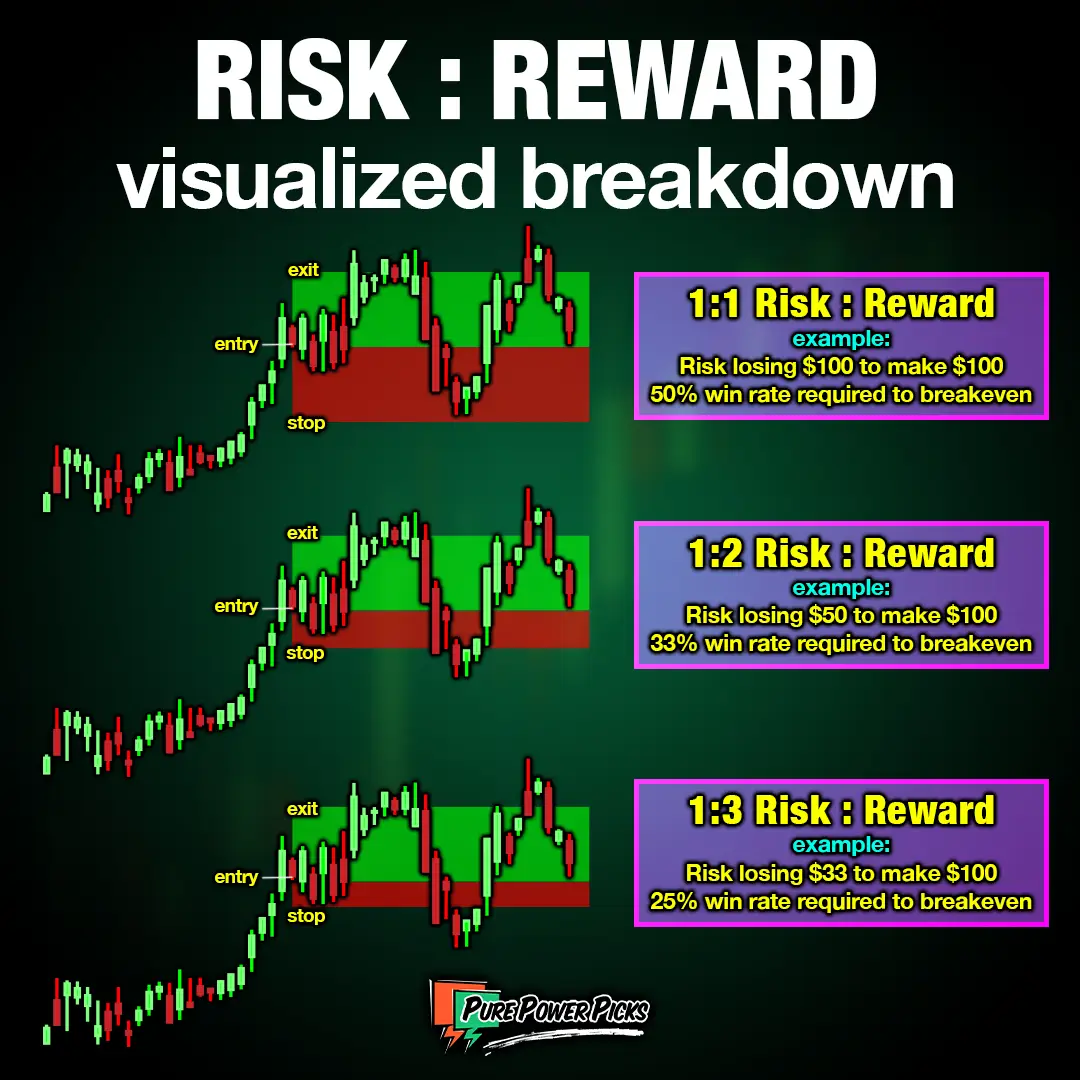
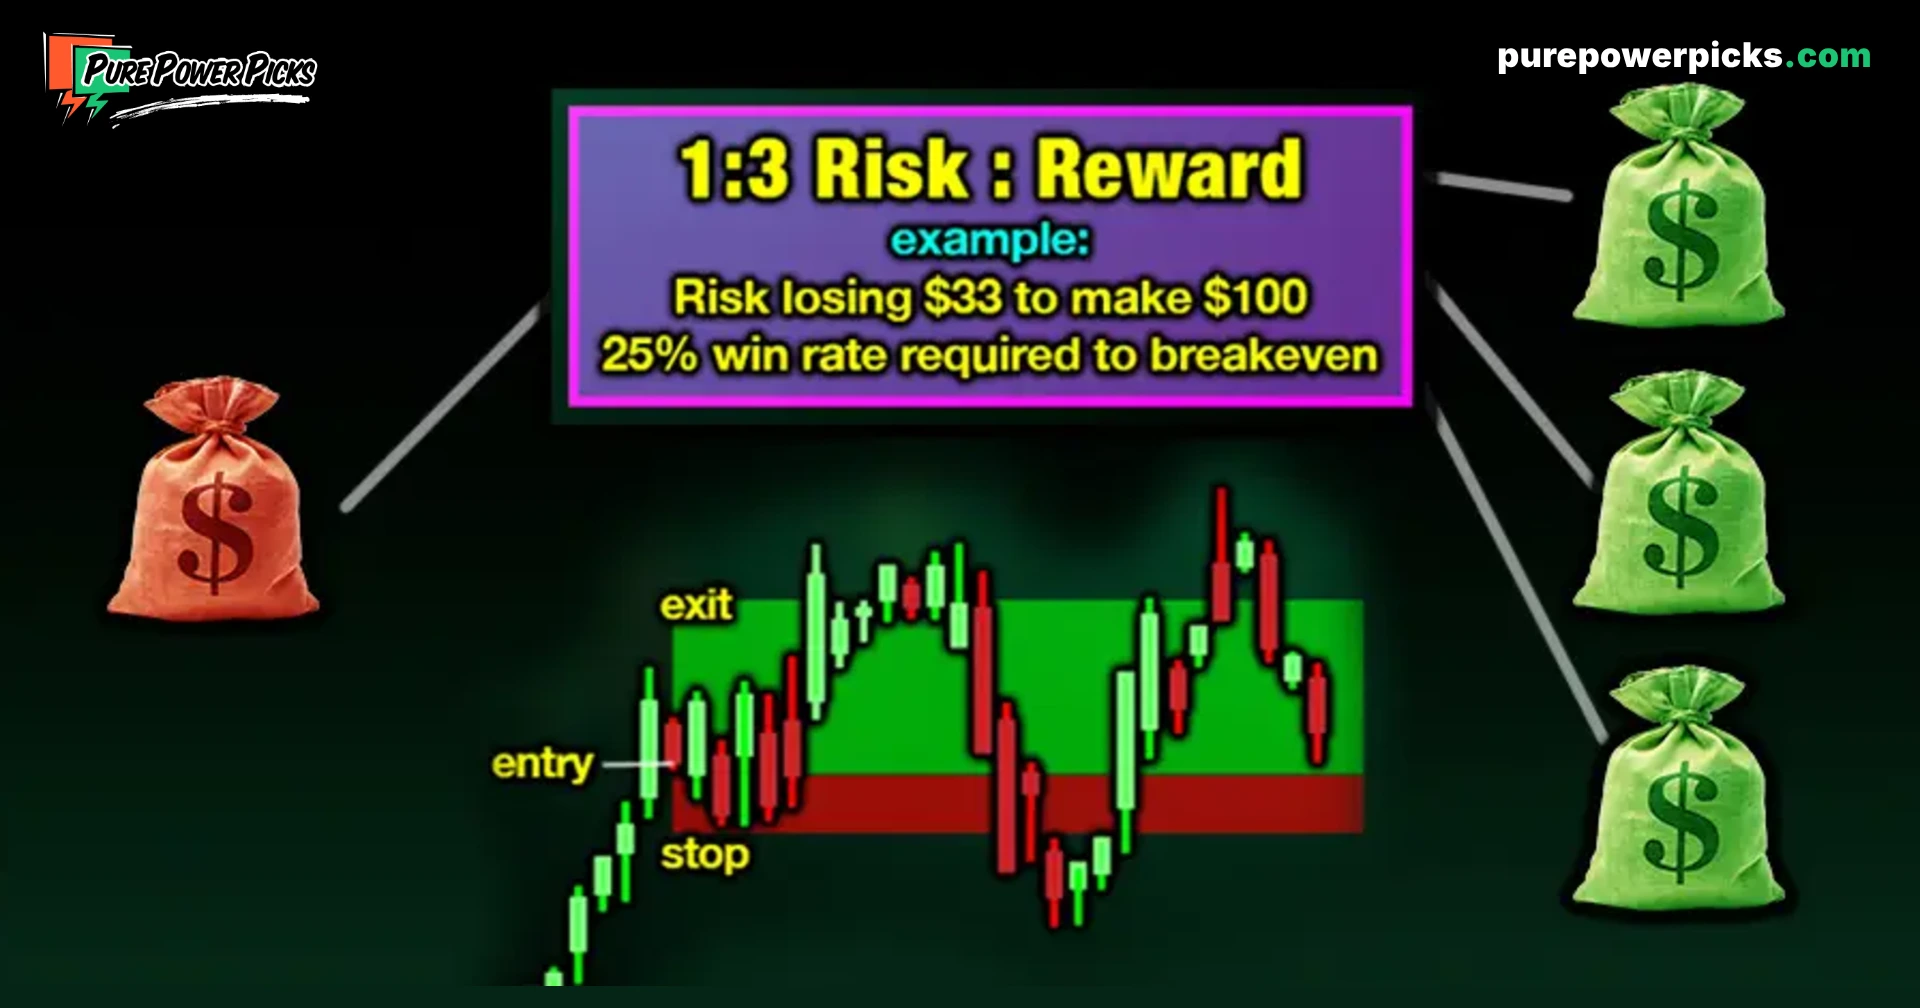
All three trades in the graphic aim for the same $100. What changes is the stop. In the 1:1 trade you risk $100 to make $100 and need to win 50% of the time. In the 1:2 trade the stop is tighter, so you risk $50 and need 33%. In the 1:3 trade you risk $33 and need only 25%.
Notice the trade-off the picture shows. The red zone gets thinner as the ratio improves. A tighter stop gives a better ratio, but it also sits closer to normal price noise, so it gets hit more often. A better ratio on paper usually comes with a lower win rate in practice. We measure exactly how much lower in the next section.
The Power of 1:3 Profit Targets
One of our favorite strategies at Pure Power Picks is aiming for a 1:3 profit-taking level. This allows for a lower win rate while maintaining long-term profitability, which is especially useful when trading volatile options or breakout stocks.
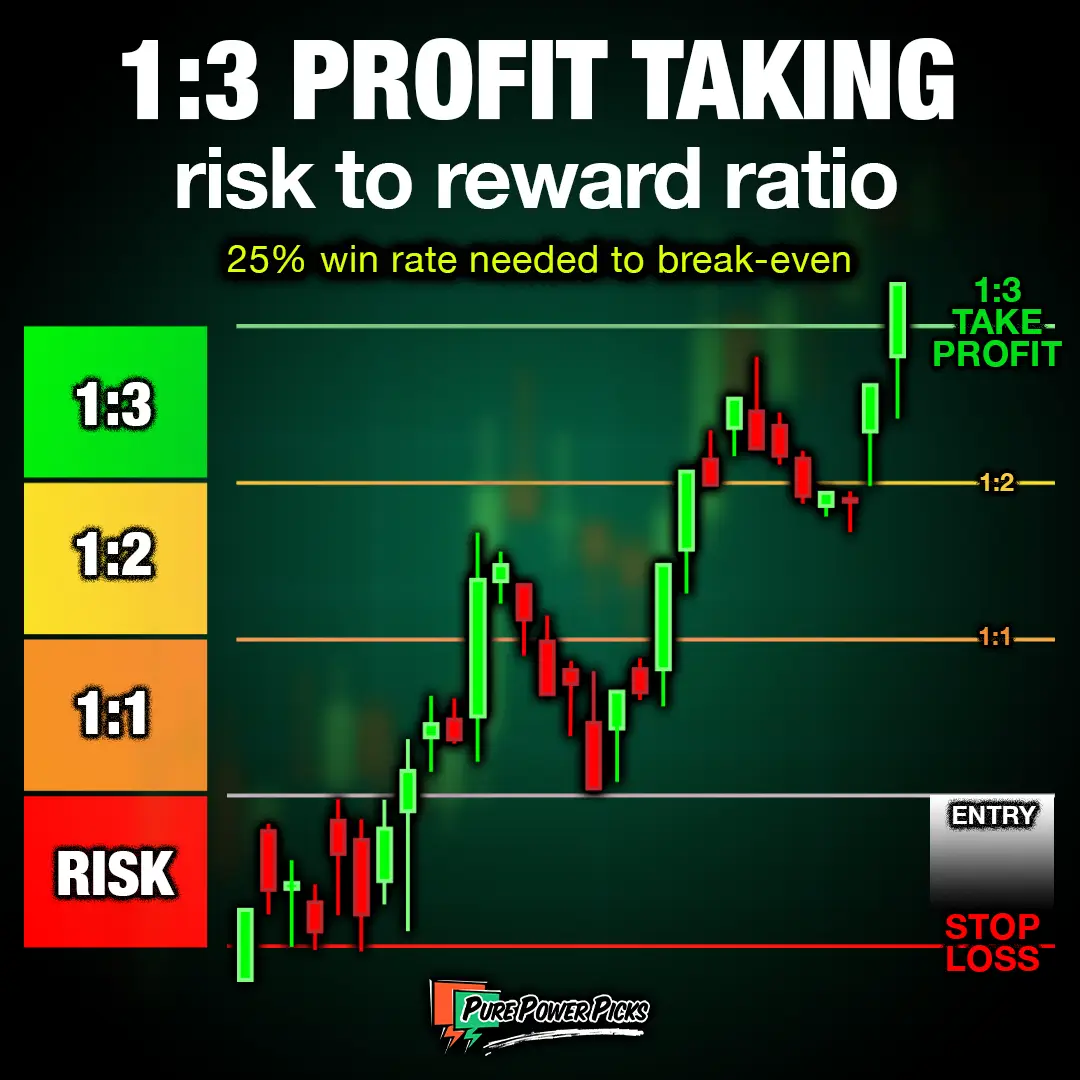
The chart shows how the levels stack. The distance from entry to stop is one unit of risk. Measure that same distance upward from the entry once, twice and three times, and you have the 1:1, 1:2 and 1:3 levels. Many traders take partial profits at the lower levels and let the rest run toward 1:3.
Does a Bigger Target Always Pay More?
Not automatically, because price has to get there. Here is a real example. Apple closed at $207.15 on June 11, 2024, breaking above its highest close of the prior 50 days on heavy volume. With a stop under the prior day’s low at $192.15, one unit of risk was $15.00 a share. That put the 1:1 level at $222.15, the 1:2 level at $237.15 and the 1:3 level at $252.15.
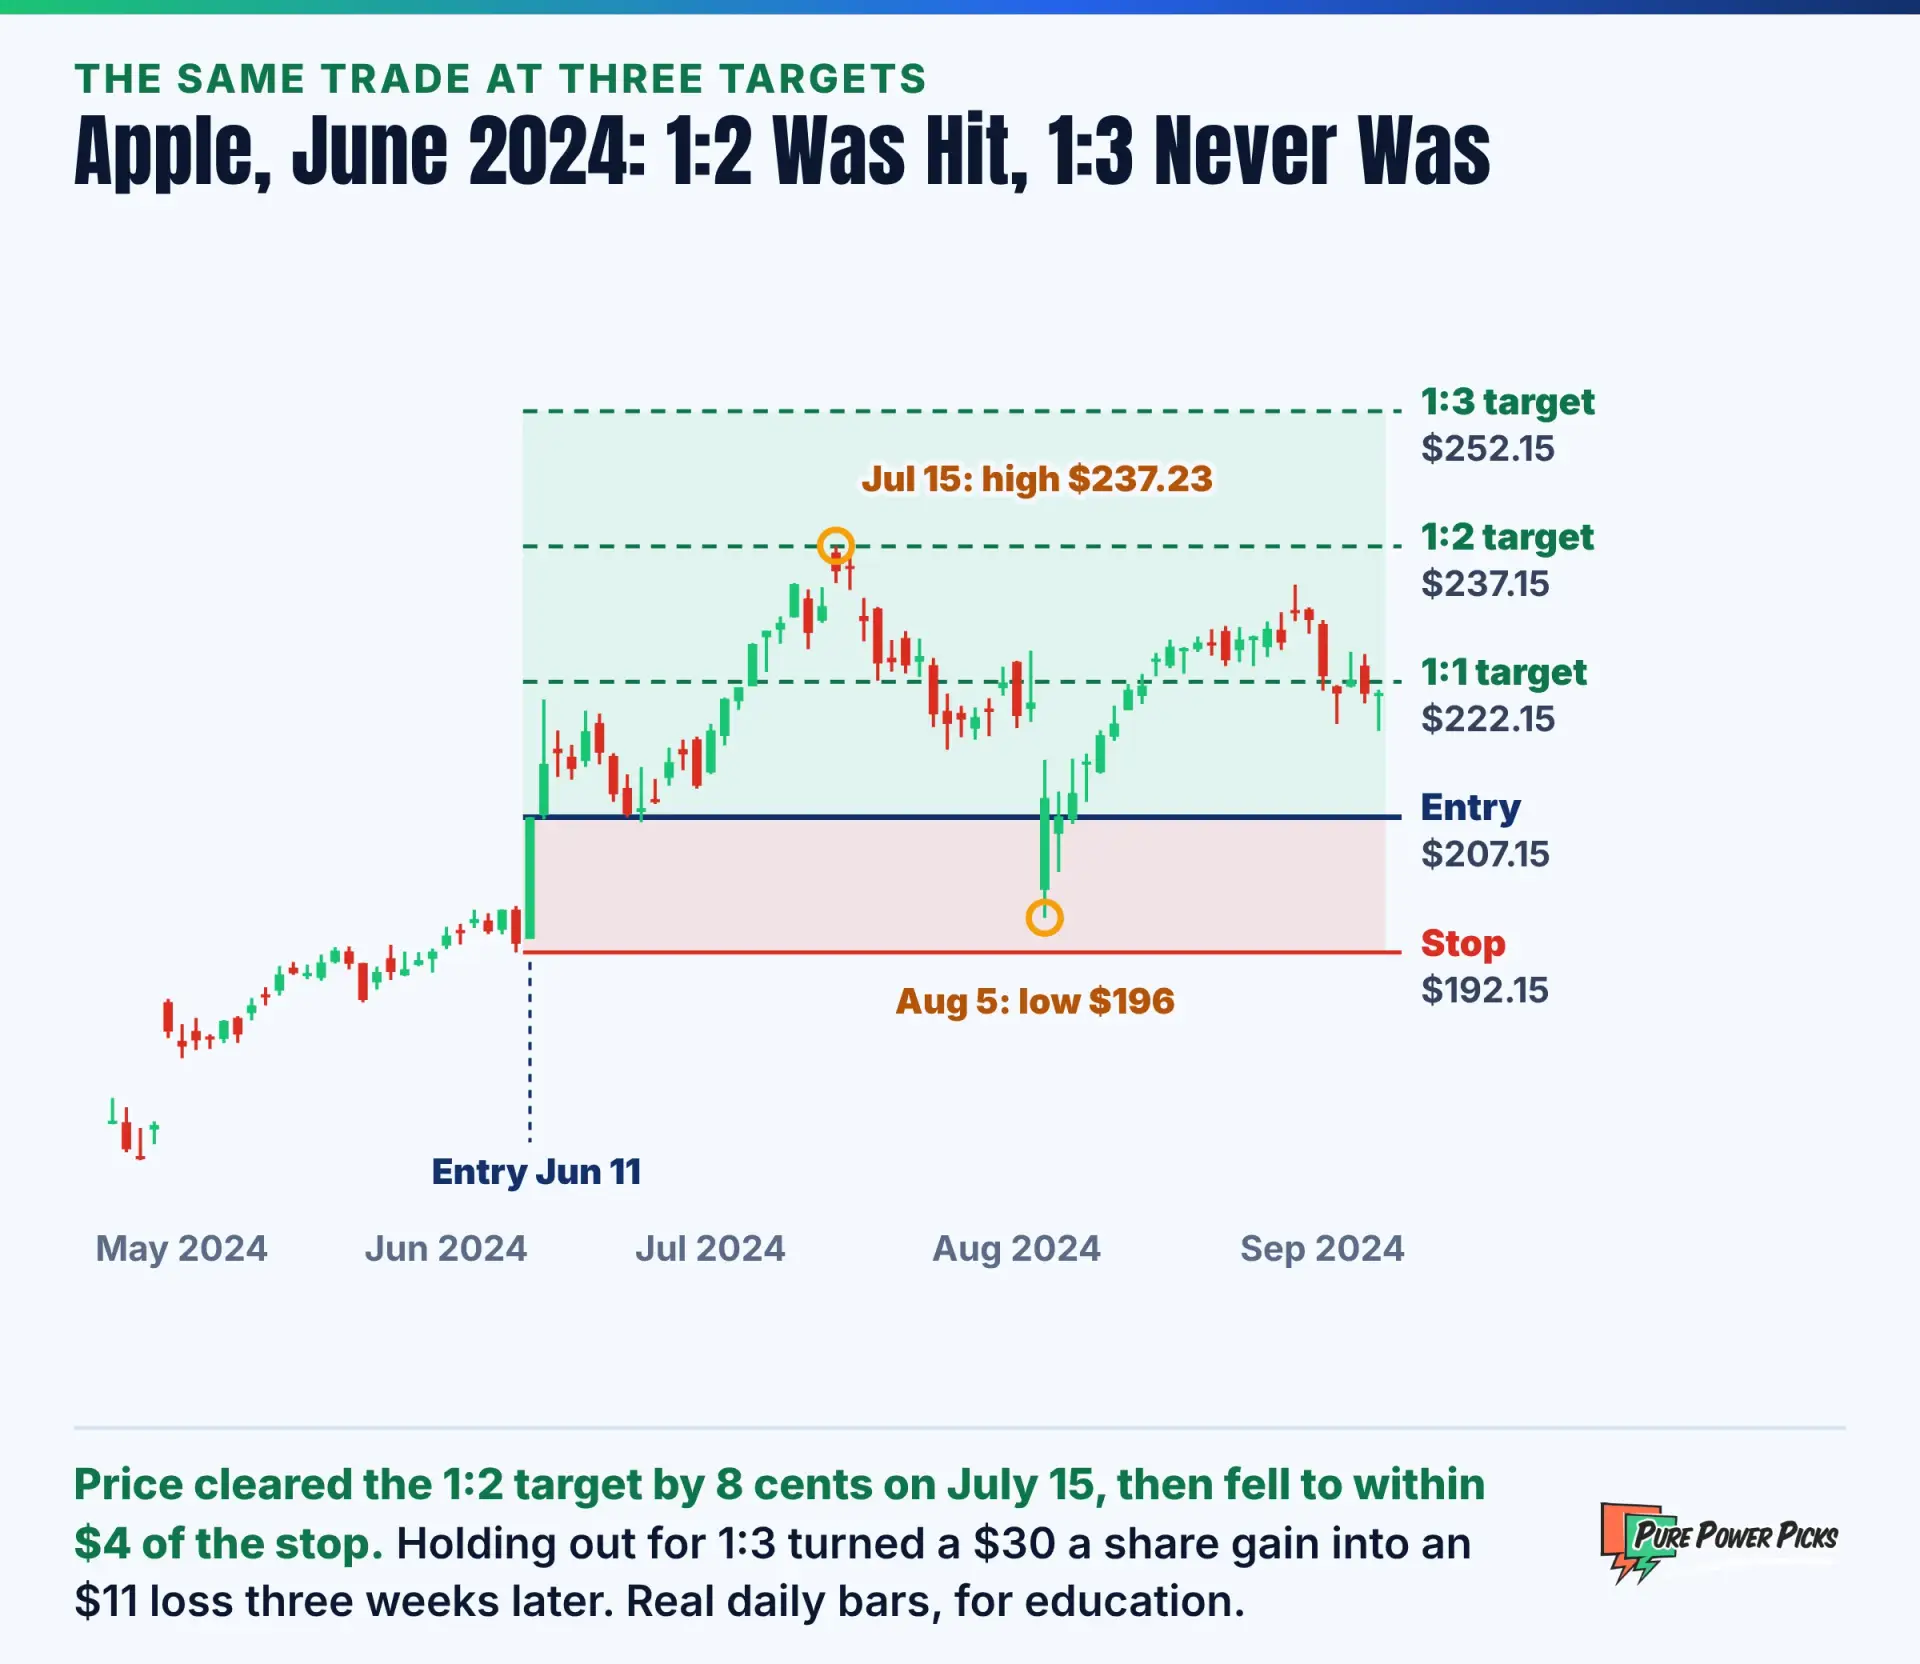
Apple reached the 1:1 level on July 5 and peaked at $237.23 on July 15, eight cents past the 1:2 level. It never came close to $252.15. Three weeks later it traded down to $196, within $4 of the stop. A trader who took 1:2 banked the gain. A trader who held out for 1:3 watched a $30 a share gain turn into an $11 loss on paper.
One chart proves nothing, so we ran the same comparison on a full set of trades: 148 breakouts across 40 large U.S. stocks from January 2024 to September 2026, all using that same entry and stop rule. We kept every entry and stop identical and changed only the target.
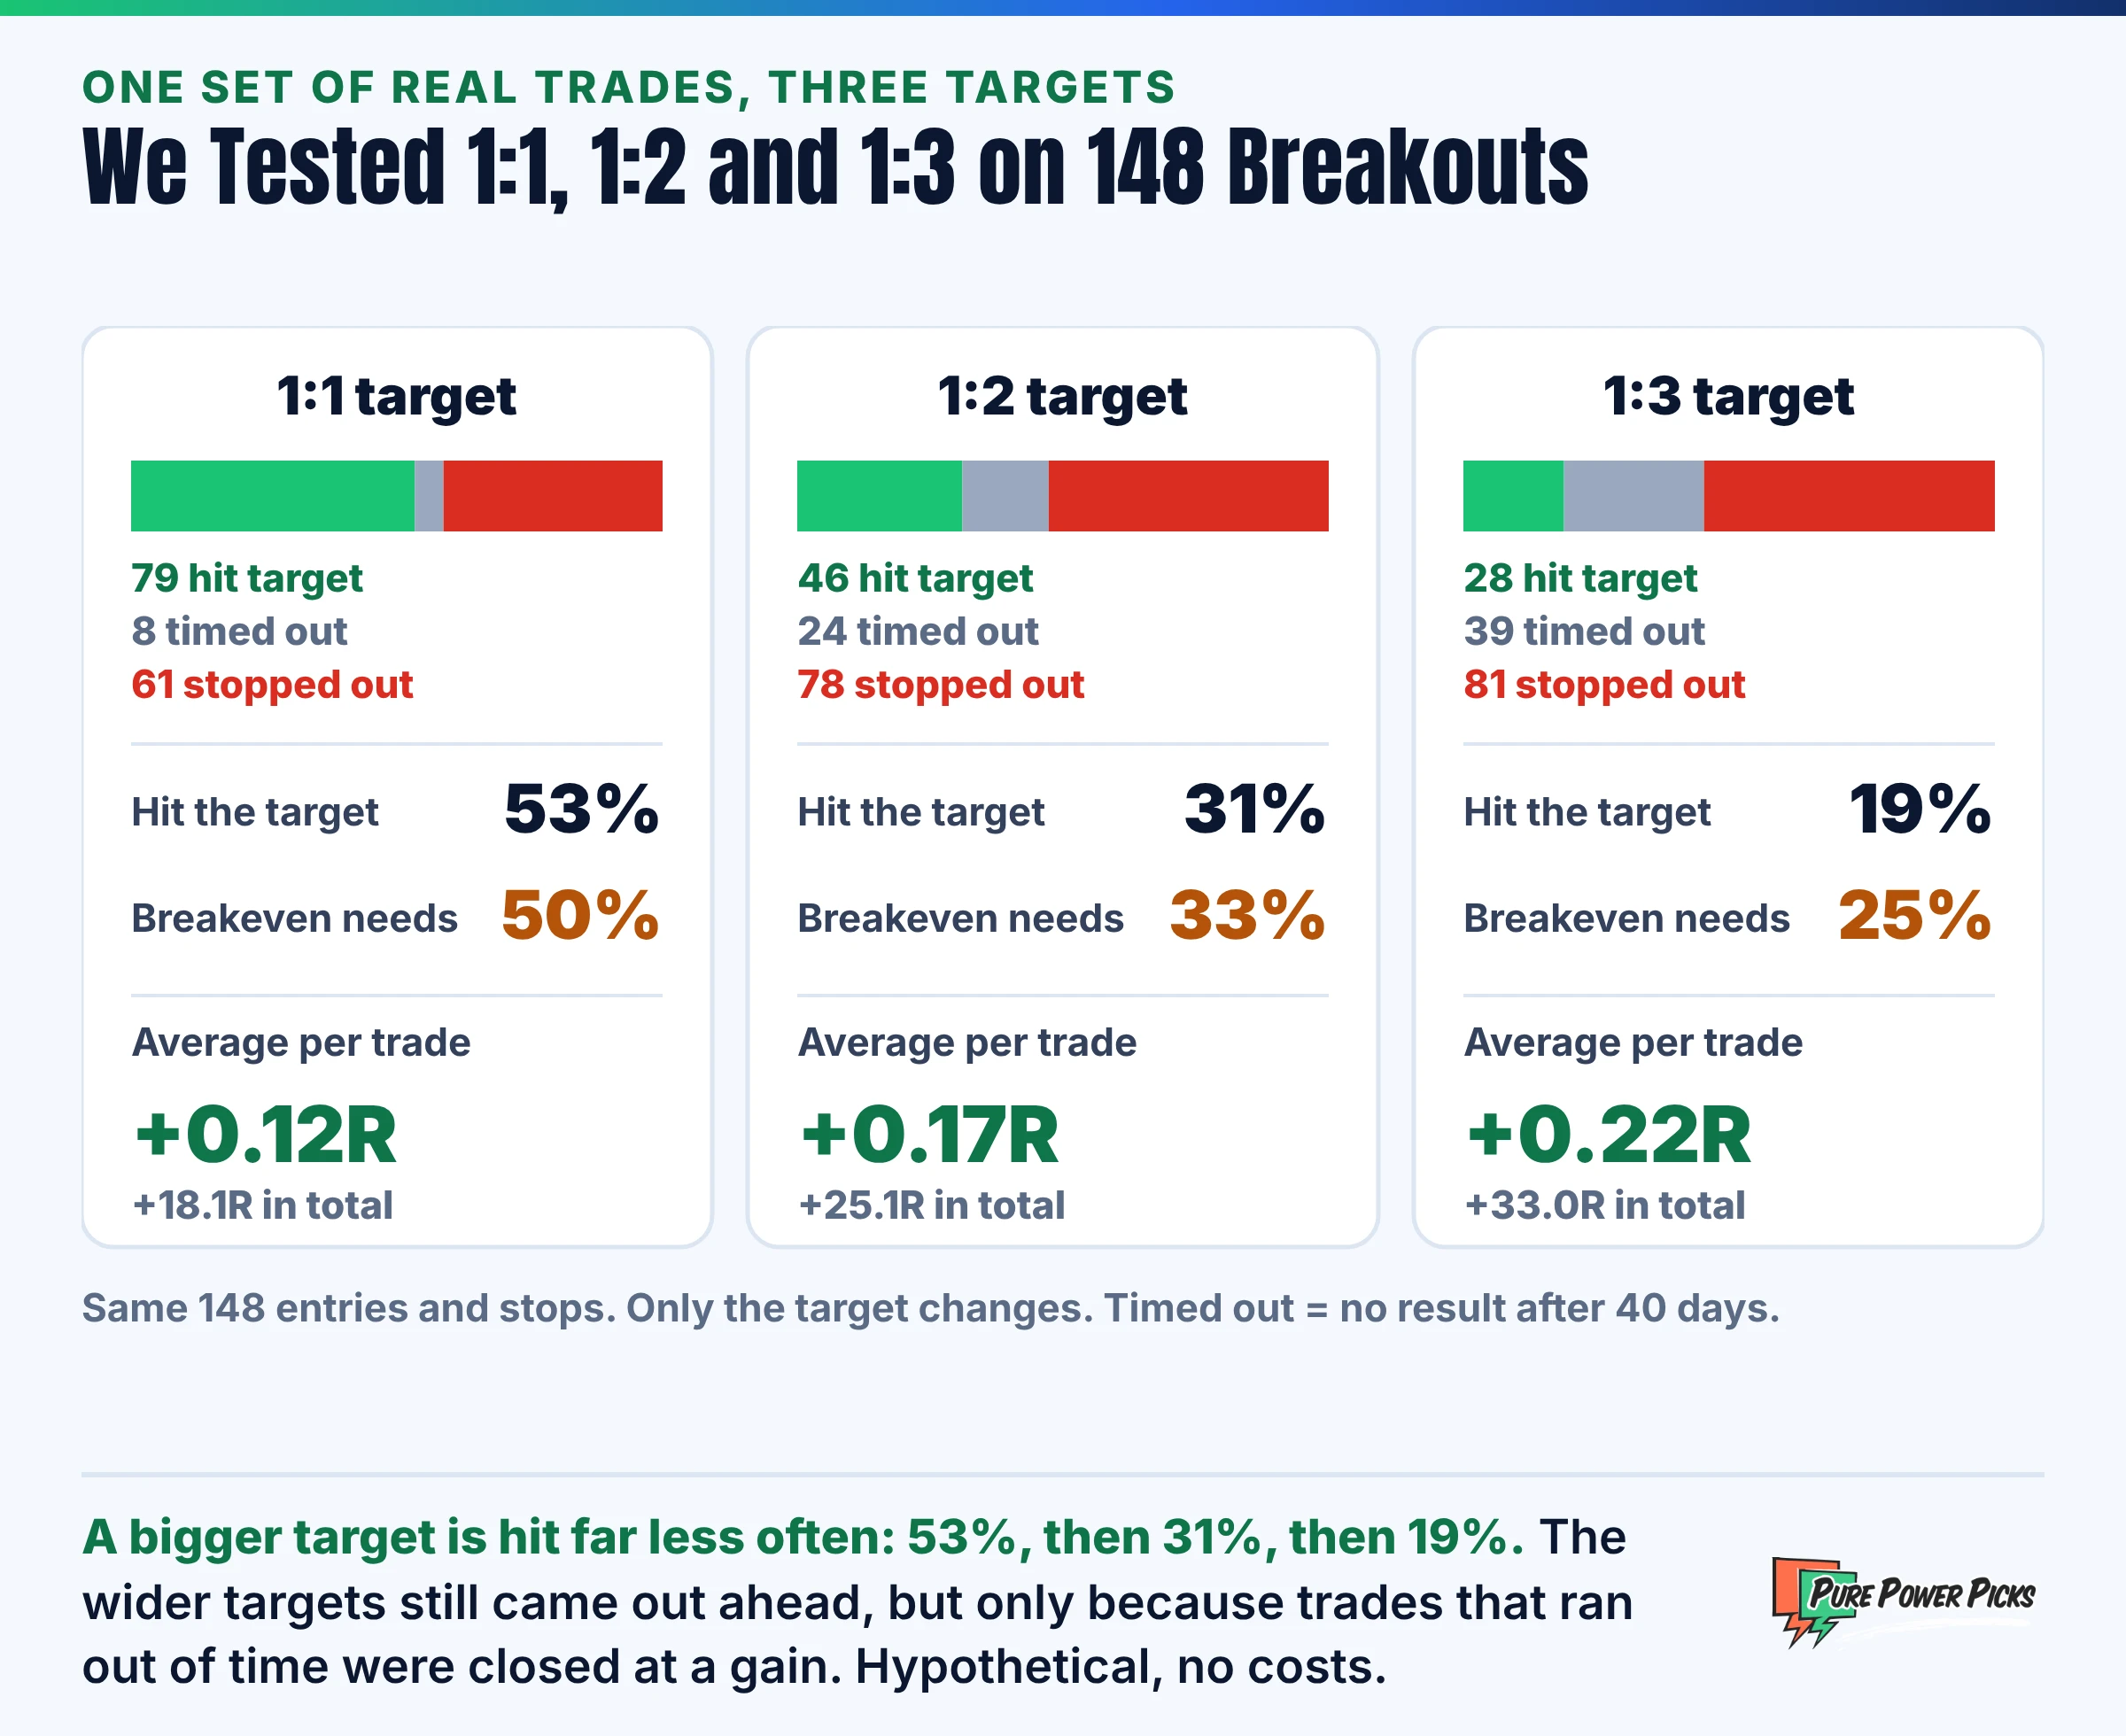
Two things stand out. First, the bigger the target, the less often it was reached: 53% of trades hit 1:1, 31% hit 1:2, and only 19% hit 1:3. Second, the hit rates at 1:2 and 1:3 were actually below the breakeven rates of 33% and 25%. The wider targets still finished ahead, at +0.17R and +0.22R per trade, because the trades that ran out of time were closed with an average gain.
The lesson is that the ratio you plan is not the ratio you get. Real trades end in three ways, not two: target, stop, or somewhere in between. A 1:3 plan can work well, but only if you have a rule for the trades that go halfway and stall.
A backtest is not a forecast. This one covers one setup on 40 hand-picked large stocks, ignores commissions and slippage, and assumes every order fills at the closing price. Past performance does not guarantee future results. Use it to understand how targets behave, not to predict what a strategy will earn.
How Does Risk-Reward Work for Options?
With stocks, you choose the ratio by choosing your stop and target. With options, much of the ratio is built into the structure before you place the trade. The max loss and max gain of a spread are fixed by its strikes and its price.
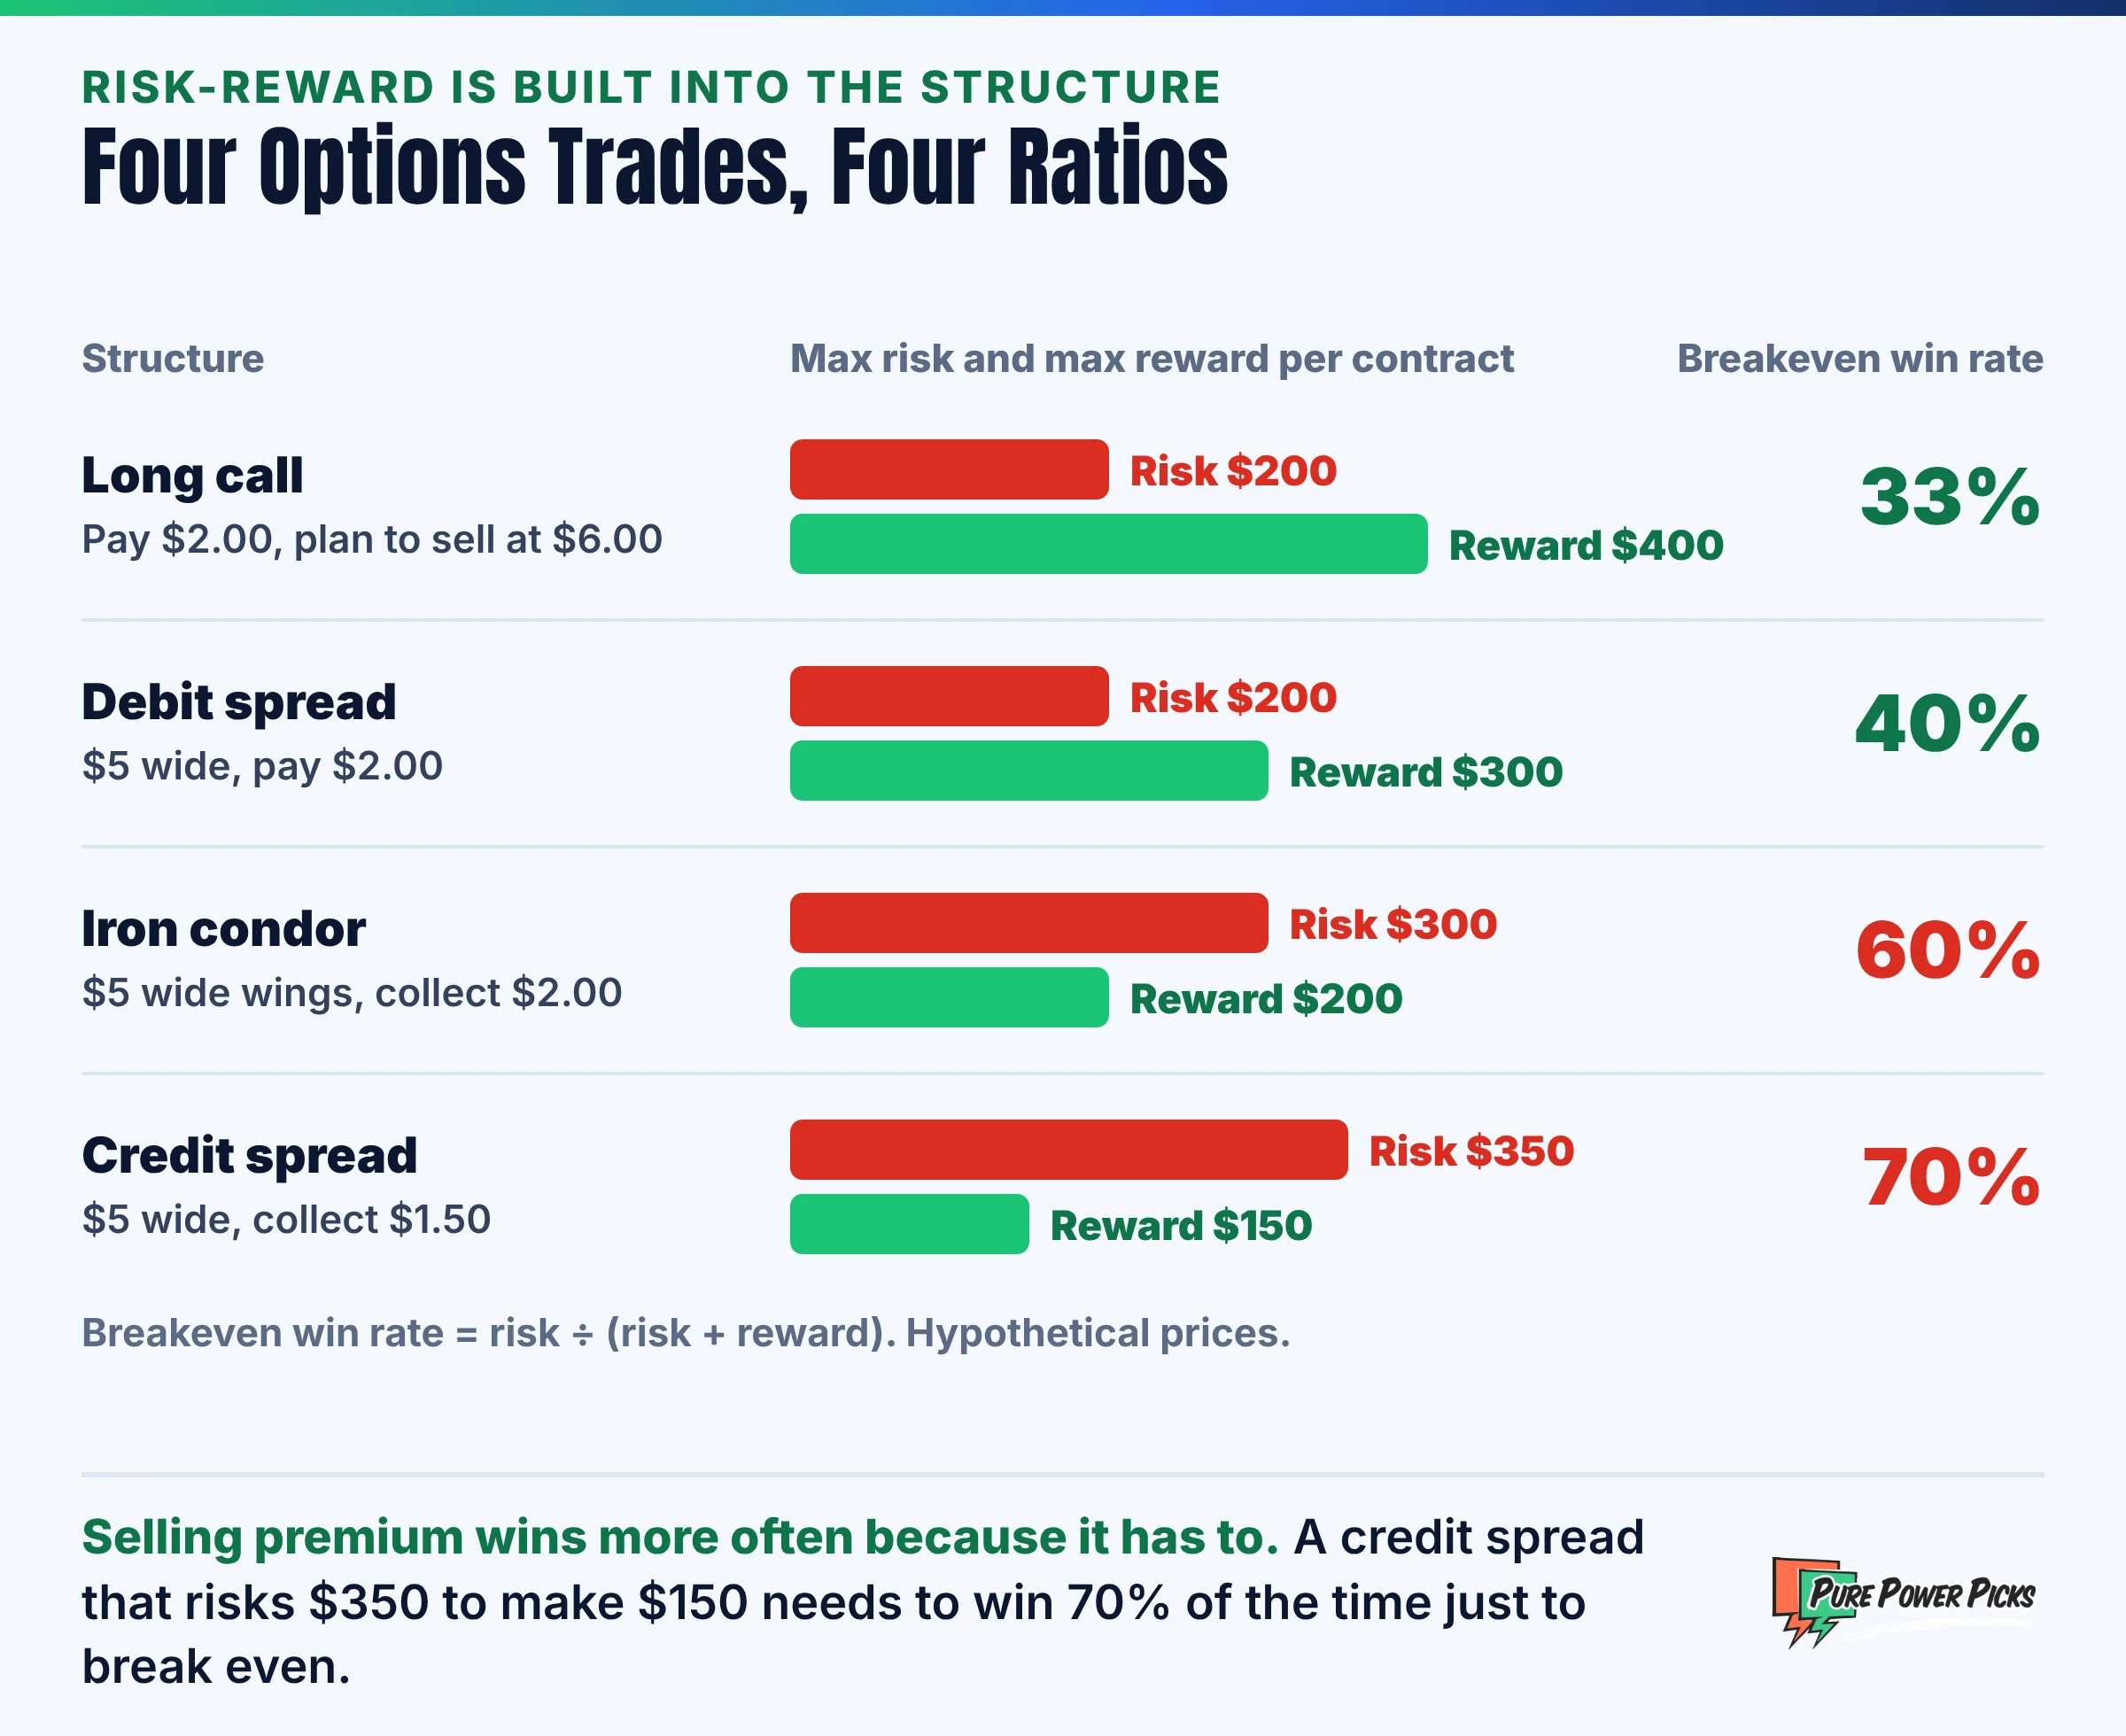
- Long call or put: your risk is the premium paid. The reward is open-ended, so the ratio depends on your exit plan. Pay $2.00 and plan to sell at $6.00, and you are risking $200 to make $400.
- Debit spread: risk is the debit, and reward is the width of the strikes minus the debit. A $5 wide spread bought for $2.00 risks $200 to make $300.
- Credit spread: reward is the credit collected, and risk is the width minus the credit. A $5 wide spread sold for $1.50 risks $350 to make $150, so it must win 70% of the time to break even.
- Iron condor: two credit spreads together. Collect $2.00 on $5 wide wings and you risk $300 to make $200.
This is why premium-selling strategies have high win rates. They need them. A credit spread that wins 70% of the time at those numbers is only breaking even. Neither side is better by default. What matters is whether your real win rate clears the breakeven rate for the structure you trade. Whatever the structure, the max loss is also the number to use for position sizing.
The Hidden Challenge: Recovering From a Loss
Another reason R:R matters is that it keeps you from digging deep holes. The bigger the loss, the harder it is to recover, and the math is not symmetric. Lose 50% of your account and you need a 100% return just to break even.
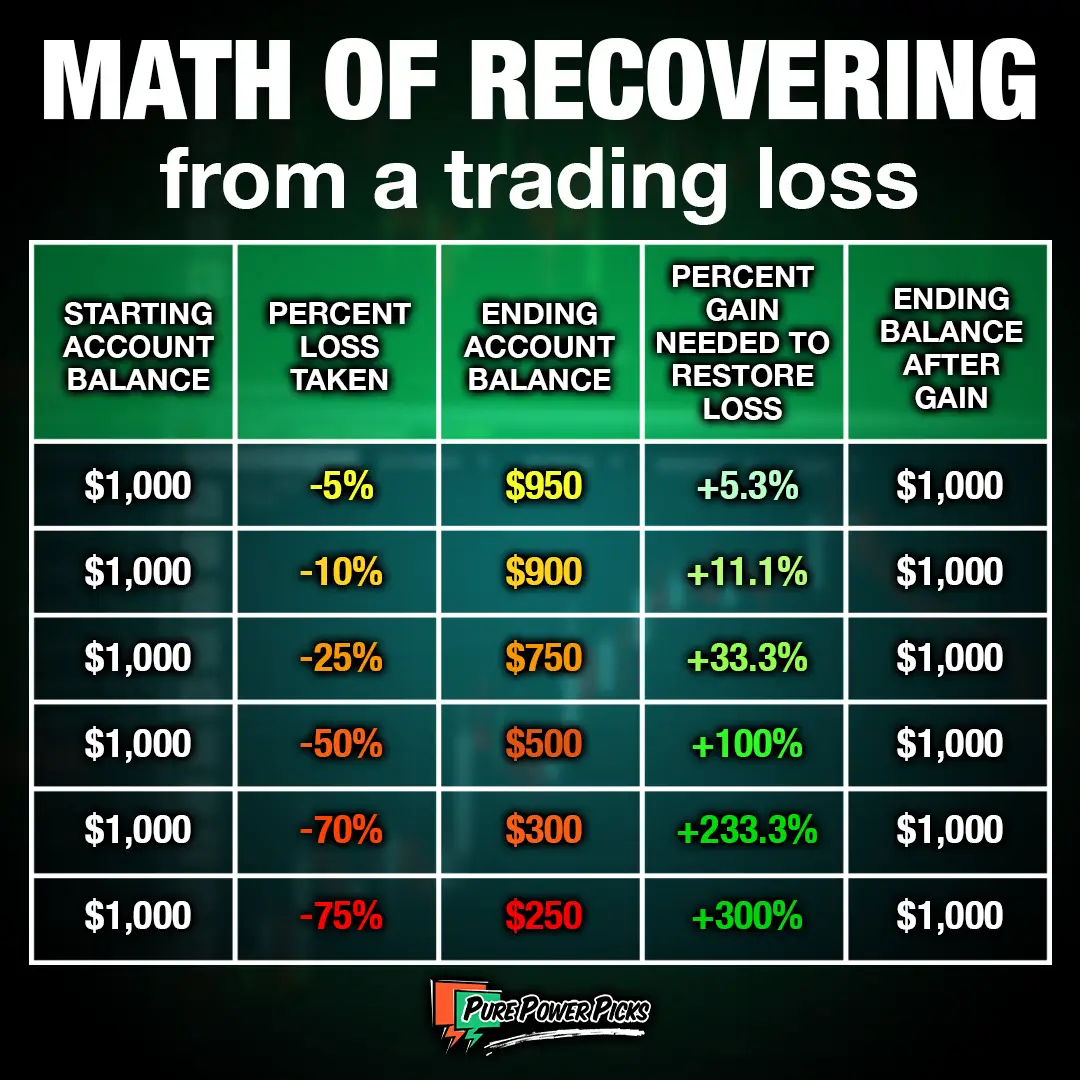
The table shows how quickly the climb steepens. A 5% loss needs a 5.3% gain to repair, which is barely noticeable. A 25% loss needs 33.3%. A 50% loss needs 100%, and a 75% loss needs 300%. Small losses are cheap to fix. Large ones can take years.
Risk-reward handles the size of each loss relative to each win. The other half is how much of the account sits behind each trade. A 1:3 trade is still dangerous if it risks 20% of your account. Keeping each loss to a small, fixed share of the account is what stops a normal losing streak from becoming one of the bottom rows of that table. Both rules belong in a written trading plan.
Common Risk-Reward Mistakes
- Setting the target by the ratio instead of the chart. A 1:3 target that sits above a major resistance level is a wish. Find where price is likely to stall first, then check whether the ratio is worth taking.
- Moving the stop once the trade is on. Widening a stop loss after entry changes the ratio you planned and usually turns a small loss into a large one.
- Judging the ratio without the win rate. A 1:5 setup that works one time in ten loses money. The ratio and the win rate only mean something together.
- Tightening the stop just to improve the ratio. A stop placed inside normal price noise will be hit again and again. The ratio looks better and the results get worse.
- Ignoring costs. Commissions and slippage come out of every trade. On small targets they can take a real share of the reward, which pushes the true breakeven win rate higher than the table says.
- Having no plan for the middle. As the 148-trade test showed, many trades hit neither the stop nor the target. Decide in advance what you do with them.
How to Use Risk-Reward on Your Next Trade
- Mark the stop first. Pick the price that proves the idea wrong, such as below a recent swing low.
- Mark a realistic target. Use the next resistance level, a prior high, or a measured move. Do not start from the ratio you want.
- Calculate the ratio. Reward ÷ risk. If it is below the minimum in your plan, skip the trade.
- Check it against your win rate. Your historical win rate on this setup should be above the breakeven rate for the ratio.
- Size the position from the risk. Divide the dollars you are willing to lose by the risk per share or per contract.
- Record the result in R. Over time your journal will show the ratio you actually achieve, which is the number that matters.
Set a minimum ratio in your trading plan and treat it as a filter, not a goal. Many traders will not take a directional trade below 1:2. Passing on a trade that fails the filter is a form of calculated risk management too.
Final Thoughts
The risk-reward ratio is more than a number. It is a way of deciding, before you enter, what a trade is worth. At Pure Power Picks, we build this principle into how we plan trades. By focusing on calculated risk and asymmetric reward, you put the math on your side even when the market is uncertain.
Whether you are just starting out or refining your strategy, this concept is worth mastering. Mark your stop, mark a realistic target, check the ratio against your real win rate, and keep each loss small. Stay focused, stay disciplined, and let the math work for you.
Frequently Asked Questions
What is a good risk-reward ratio?
Many traders look for at least 1:2 on directional trades, which breaks even at a 33% win rate. A higher ratio is not automatically better, because larger targets are reached less often. A good ratio is one where your actual win rate sits comfortably above the breakeven rate.
How do you calculate the risk-reward ratio?
Subtract your stop from your entry to get the risk, and subtract your entry from your target to get the reward. Then divide reward by risk. An entry at $50 with a stop at $48 and a target at $56 risks $2 to make $6, which is 1:3.
What win rate do you need at 1:3?
25%, before costs. The formula is risk ÷ (risk + reward), so 1 ÷ 4. At 1:2 you need 33%, and at 1:1 you need 50%.
Is 1:3 better than 1:2?
Not always. In our test of 148 breakout trades, the 1:2 target was reached 31% of the time and the 1:3 target only 19% of the time. The 1:3 version still earned slightly more per trade, but only because trades that timed out were closed at a gain. The right choice depends on how far your setups usually run.
Does risk-reward work the same way for options?
The idea is the same, but the structure sets much of the ratio. A credit spread typically risks more than it can make and needs a high win rate. A debit spread or long option risks less than it can make and can succeed with a lower one.
Can you be profitable with a win rate under 50%?
Yes. If your average winner is larger than your average loser, you can lose more often than you win and still come out ahead. At 1:3, a trader who wins 35% of the time earns 0.40R per trade on average before costs.
Want to See Entries, Stops and Targets on Real Setups?
Pure Power Picks is built education-first. Our alerts share chart setups with the alert price, the reasoning and the levels behind them, so you can work out the risk-reward for yourself before you decide anything.
Explore Alert Plans
The PPP Team is the research and editorial team behind Pure Power Picks. We trade stocks and options and publish the work as we do it, with every alert tracked in public. Publishing since 2020. How we research and correct our work is written out in our editorial standards. Our content is strictly educational, never advice.
Disclaimer: The information provided by Pure Power Picks is for educational and informational purposes only and should not be considered financial, investment, or trading advice. We are not registered financial advisors. The examples in this article, including the backtest and the chart built from historical prices, are hypothetical and are not actual trades or recommendations. Options trading involves substantial risk and is not suitable for all investors; you can lose more than your initial investment. Past performance, including any historical alert data, does not guarantee future results. Always do your own research and consult a licensed financial professional before making any investment decisions.