


PM Options +211%: Philip Morris Hits a Record Ahead of Q3 Earnings
Share


On October 15, Philip Morris International (PM) opened at a record $210 and touched $210.45 before fading to close at $199.90. That morning, the PM $200 calls Pure Power Picks alerted on September 30 at $4.70 traded as high as $14.60, a high of +211%.
The idea did not start that day. PM went on the PPP weekly watchlist on August 23 with the levels the stock later respected. It got a first alert on August 26, and the alert this case study follows on September 30, after PPP’s alert pipeline scored the setup again. Below is the whole chain, from the watchlist chart to the tracker’s record of every session after the alert.
The analyst thesis was specific from the first line: “PM is holding over the weekly 13ema with the weekly chart getting tight under the highs. Look for a move into and over $196.66, prior resistance and a potential breakout spot, to open $200 in the coming weeks.”
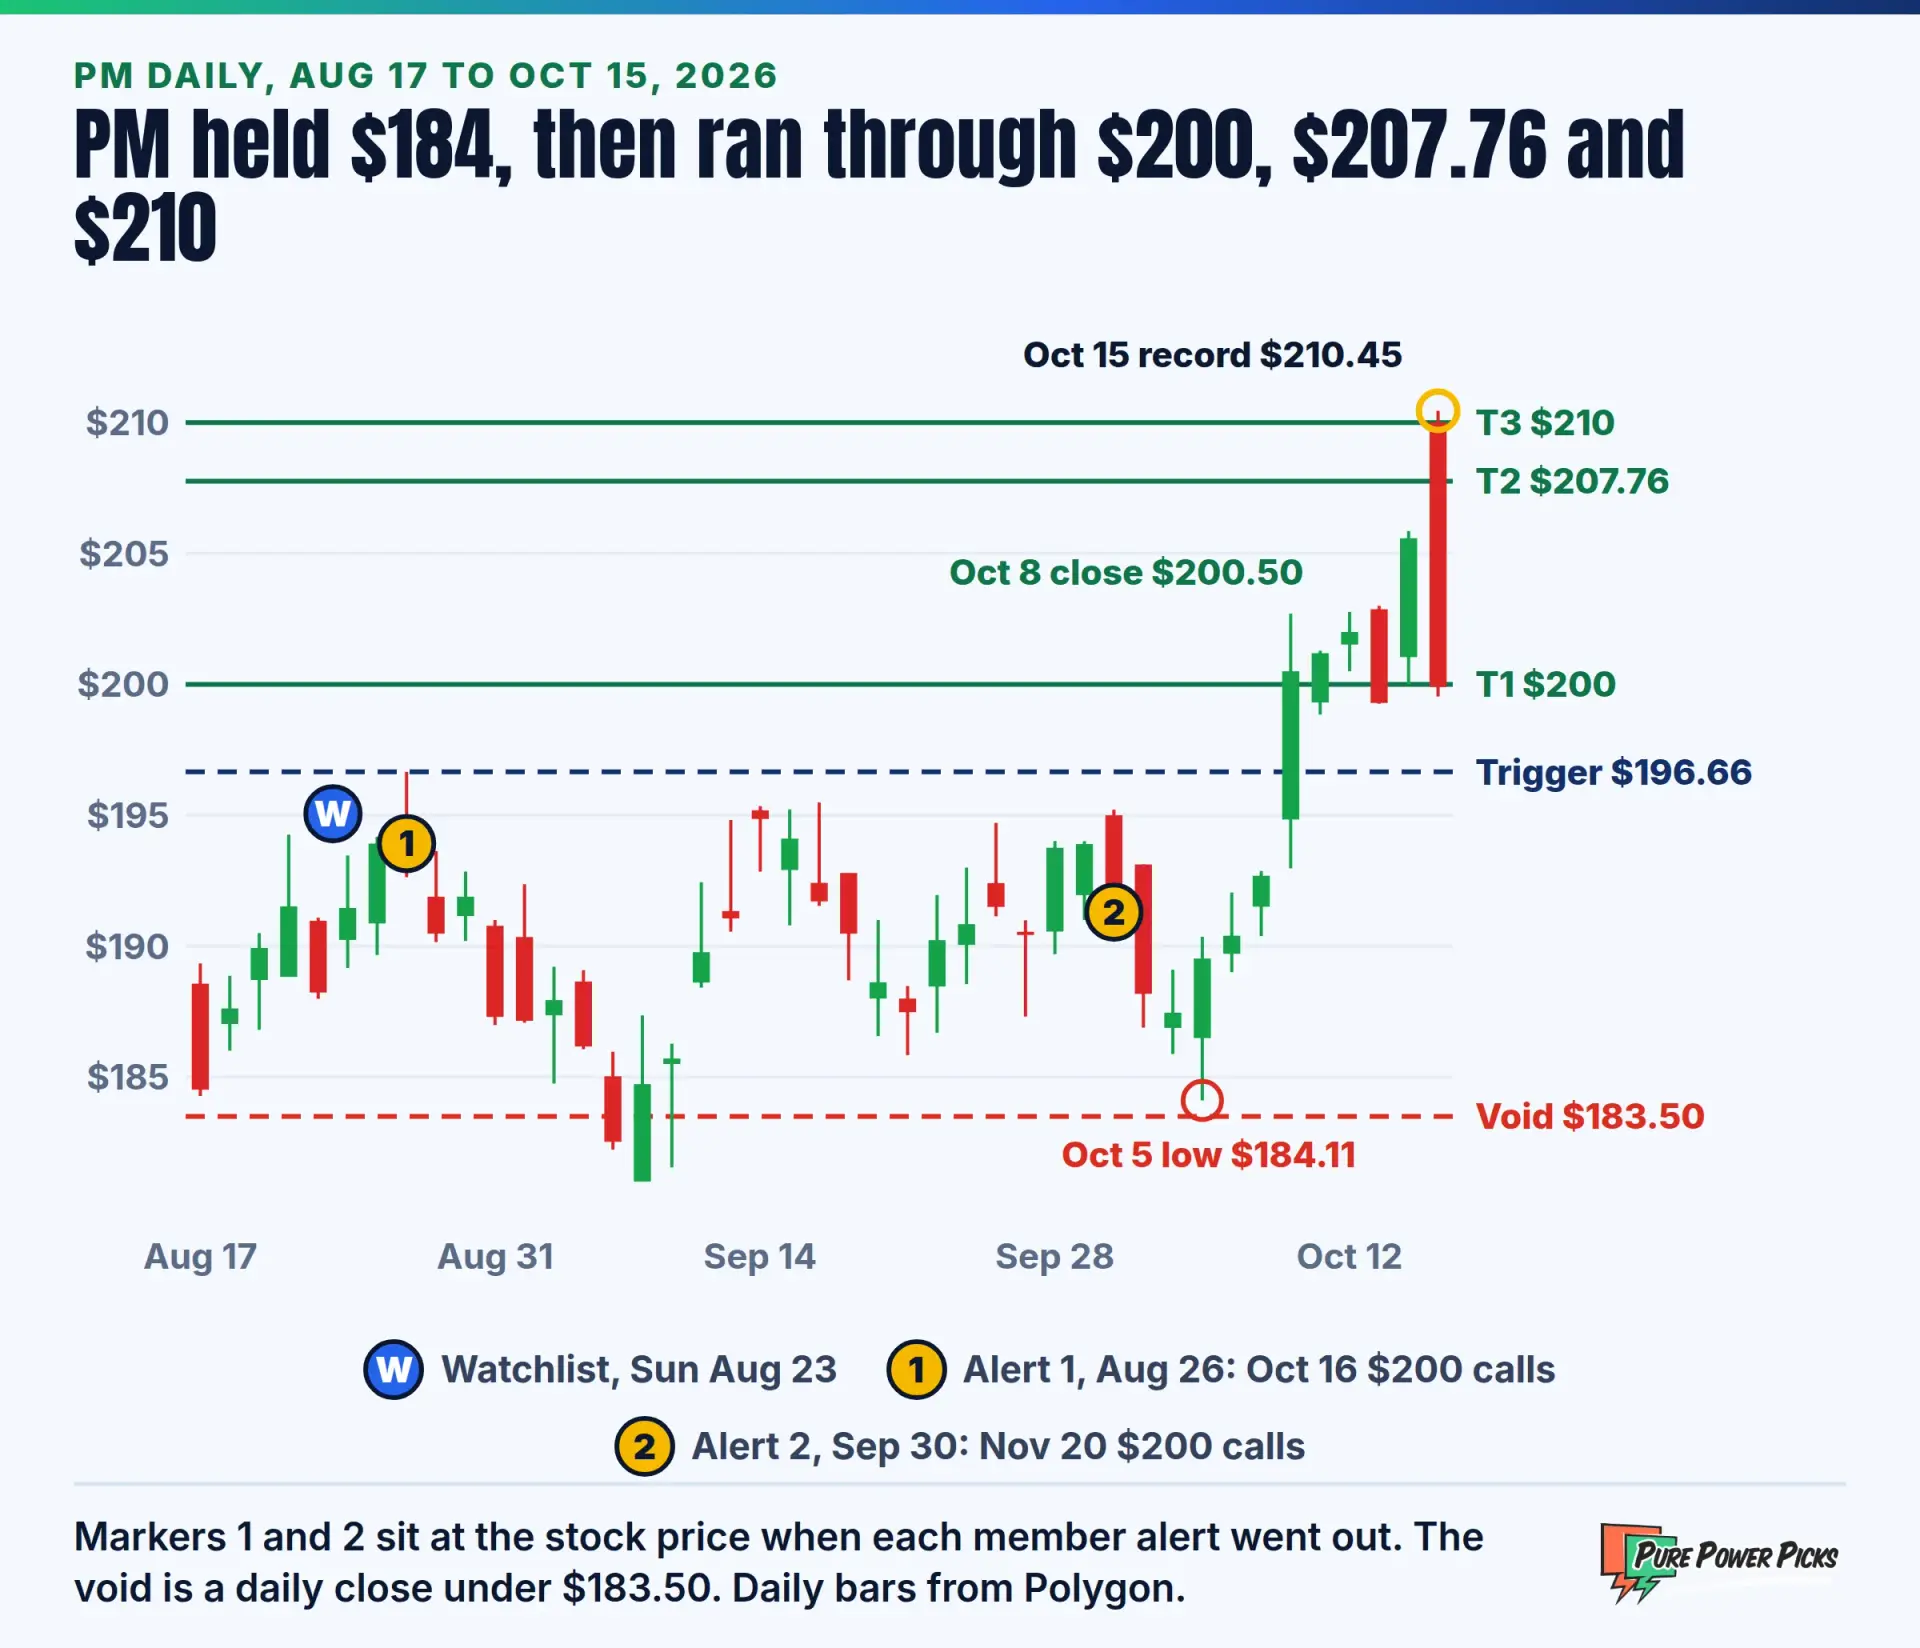
PM sat on the PPP watchlist for five weeks before this alert. The September 30 alert named a trigger ($196.66), four targets and a void ($183.50). PM tested the void to within 61 cents on October 5, cleared the trigger and $200 on October 8, and opened at a record $210 on October 15, when the $4.70 call reached a high of $14.60, +211%.
It Started on the Watchlist
PM first showed up in our weekly Stocks To Watch list for August 23. The note read: “PM, weekly chart ascending and getting tight, looks like could see an upside breakout with time.”
It mapped support at $186 and $184, a breakout trigger at $194.26, and upside targets at $197.50, $200, $207.76, $210 and $225. Here is the chart that went out with it.

The watchlist is a study list, not a buy list. It maps a setup on the weekly chart, so that when the daily chart lines up, the alert can be specific. Three days later it was: on August 26, PPP alerted PM $200 calls expiring October 16 at $5.00, with a move over $194.26 as the trigger.
That first alert had the right levels and too little time, which we cover below. Five weeks later the weekly chart was tighter, the trigger had moved up to $196.66, and the setup came back around.
The PPP Alert Intelligence System at Work
Here is the whole chain on one page, with the times the alert tracker recorded.
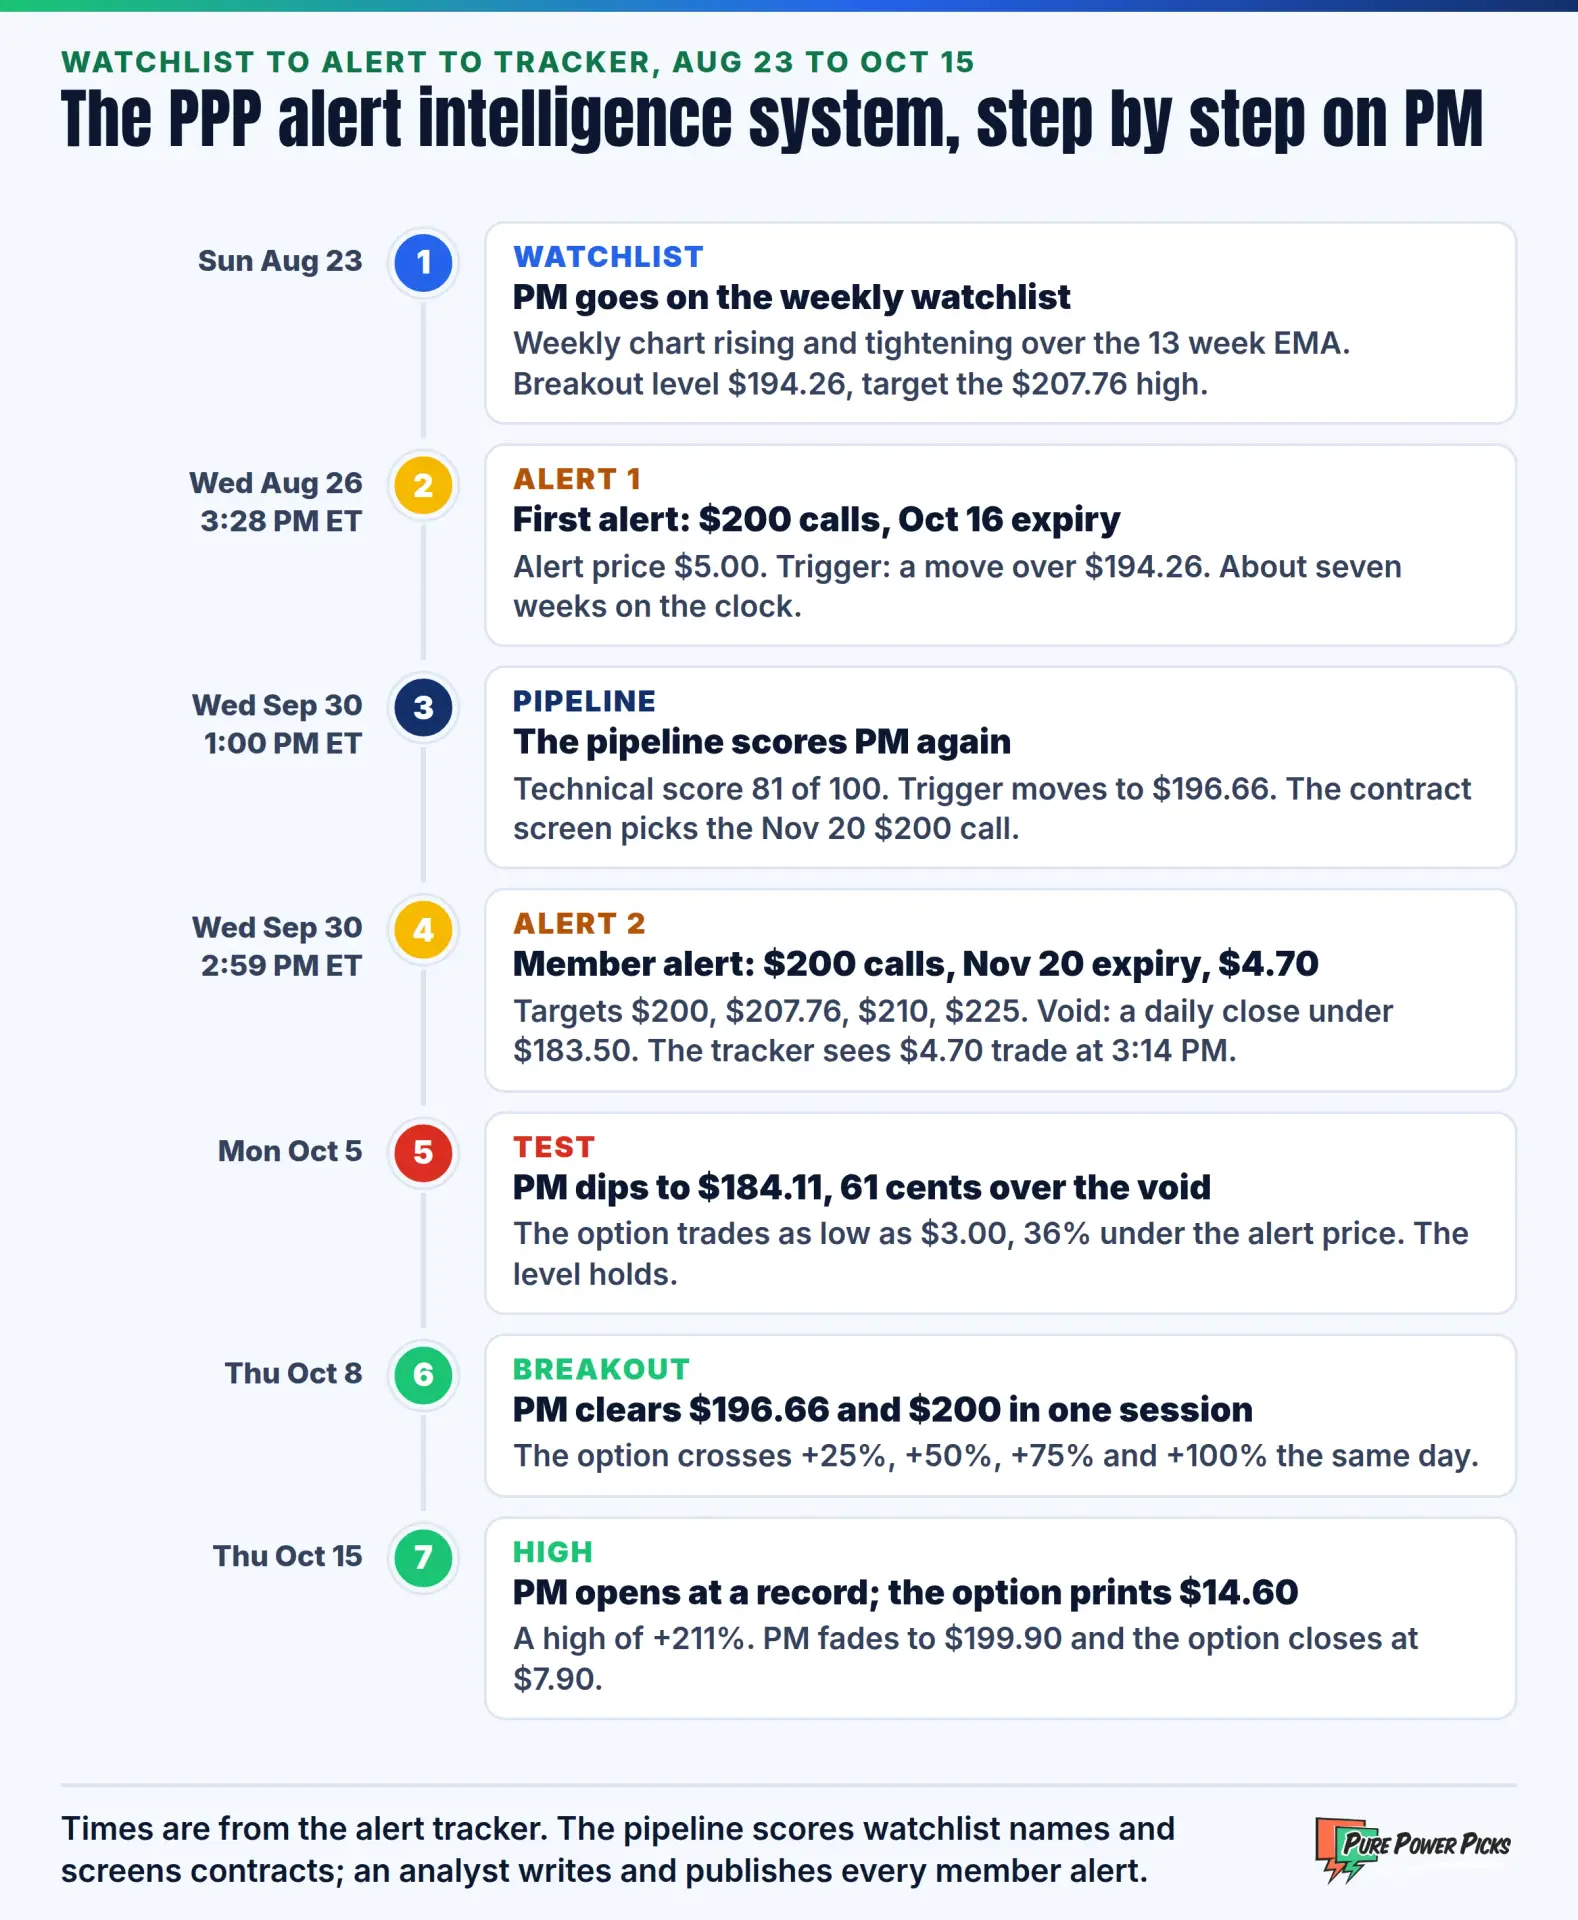
Three parts do three jobs. The weekly watchlist maps setups by hand. PPP’s alert intelligence pipeline then scores watchlist names on technicals, options flow and sentiment, and screens the option chain for a contract. On September 30 at 1:00 PM ET it scored PM’s technicals 81 out of 100 and picked the November 20 $200 call.
An analyst writes and publishes every member alert. This one went out at 2:59 PM ET at $4.70, with four targets and a void. From there the tracker takes over: it confirmed the $4.70 alert price traded at 3:14 PM ET and logged every day’s high, low and close against it. Every number in this case study comes from that record and from Polygon market data.
What Was the PPP Alert Thesis?
The thesis started with trend structure. PM was holding above its weekly 13 EMA, a moving average that often acts as support in a healthy uptrend. The weekly candles were also compressing just under the highs. That kind of tightening often comes before expansion.
From there, the analyst laid out a level by level roadmap:
- Alert zone: $184 to $190. The support area where risk was most clearly defined, with $188 to $190 called out for strong risk to reward.
- Breakout trigger: $196.66. Prior resistance, and the August 26 high. A move into and over it was the signal that buyers had control.
- T1: $200. The strike price, and the first objective once the trigger cleared.
- T2: $207.76. The July 28 high, the 52 week high at the time of the alert.
- T3 and T4: $210 and $225. In play only on a break to new highs with no overhead supply.
- Void: $183.50. A daily close below this level invalidates the idea.
What makes this thesis useful for learning is its conditional structure. Each target depends on the level before it holding. The analyst did not just call PM bullish; the alert described what needed to happen, in order, for the idea to keep working.
PM was at $191.30 when the tracker confirmed the alert price traded, near the top of the alert zone. By October 15 it had traded through T1, T2 and T3. T4 at $225 is still open, with the contract running to November 20.
This Is Exactly What Members Got
When the alert fired at 2:59 PM ET on September 30, members got the complete package in one place: the contract, the $4.70 alert price, the full written thesis, four targets, the support zone and the void.

The alert also carried the analyst’s own chart: the weekly view with every level drawn in, the earnings date and the contract’s expiration.

Members did not just get a ticker. They got a roadmap they could check against the chart in real time. Alerts reach members on the PPP dashboard, in Discord and by text message, so they are hard to miss, and members choose which channels they opt into.
What News Drove the Move?
There was no single headline. PM’s run came from a steady bid for defensive consumer staples and a business the market keeps paying more for.
In September, Philip Morris raised its quarterly dividend 8.8%, to $1.60 a share, according to the company’s filing with the SEC. According to Barchart’s coverage, shares were up about 26% this year on demand for heated tobacco and nicotine pouches, the smoke-free business investors now treat as a growth driver rather than a legacy tobacco income story.
On October 8, PM rose 4.1% to $200.50, its highest close of the past year, with no company announcement behind it. On October 15 it opened at $210, a record high per Investing.com, ahead of third quarter results expected around October 20 to 21. It then reversed and closed at $199.90, down 2.8% on the day.
Barchart also raised a real counterweight: rising Treasury yields. Higher yields can pressure dividend-heavy stocks like PM, because bonds become more competitive for income buyers. That risk is still worth watching into the report.
How did the news line up with the thesis? The chart did the work first. The watchlist and the alert mapped a stock coiling under its highs, and the steady bid supplied the push through $196.66 and $200. For a deeper look at event-driven setups, see our guide to trading options around earnings.
How Did the Options React?

On September 30, the $200 call was about $9 out of the money, so the $4.70 alert price was all time value. It needed PM to move, and soon enough to beat time decay.
The tracker’s milestones tell the story in order. The contract crossed +10% on October 6, then +25%, +50%, +75% and +100% all on October 8, when PM rose through $196.66 and the $200 strike. It traded as high as $10.60 that day.
On October 14, PM closed at $205.58 and the call at $11.00. The next morning PM opened at $210 and the call traded at $14.60, its high, +211% from $4.70. By the close PM was back at $199.90, and the call had dropped 28% on the day to $7.90, still +68% from the alert price.
As of the October 15 close, the call carried a delta of about 0.51 and theta of about -0.11. It moves about 51 cents for each $1 in PM and loses roughly 11 cents a day to time decay, with implied volatility near 31%.
What About the Drawdown? Where a Stop Comes In
The tracker records the dips too. On October 1, the session after the alert, the call traded as low as $3.30, 30% under the $4.70 alert price, and closed at $3.70. On October 5 it went lower, to $3.00, 36% under.
Part of that dip was mechanical. PM went ex-dividend on October 2, and a stock typically opens lower by about the dividend, $1.60 here. Call holders do not receive the dividend, so the call absorbs the drop.
The stock shows why the dips did not end the idea. PM’s low on October 5 was $184.11, 61 cents above the $183.50 void, and it never closed below it. A stop anchored to the chart survived. A tight percentage stop on the option, say 20% or 25%, would have closed the trade on October 1, a week before the breakout.
That is the case for anchoring risk to the underlying’s technical level and sizing so a full loss to it is absorbable. Decide in advance whether you will use a hard stop order or a mental level, and stick with that plan. A long call can expire worthless; read the Characteristics and Risks of Standardized Options before you trade them. This is educational context, not a recommendation.
Same Strike, Different Clock: The August Alert
The first PM alert deserves an honest look, because it was the same strike and the same thesis. The October 16 $200 calls, alerted August 26 at $5.00 and tracked from $5.10, needed PM to break out over $194.26. PM poked above it in mid September, then stalled under $196.66 for five more weeks.

With time running out, the October contract fell as low as $0.33 on October 5, 94% under its tracked price. When PM finally broke out, it reached a high of $9.30 on the morning of October 15, +82%, then closed at $1.20 as PM fell back under $200, one day before expiration.
Same chart, same strike, a very different ride. The November contract had seven weeks of runway from September 30, so the October 5 test cost it 36% instead of 94%, and it was still alive for the breakout. Time is part of the trade.
What Can Traders Learn?
1. Prepare on the watchlist, act on the alert. PM was mapped on the weekly chart five weeks before the alert that worked. The preparation is what made the alert specific: a trigger, four targets and a void, in order.
2. Strike selection should match the roadmap. The $200 strike was also T1, so the thesis’s first objective was the point where the option gained intrinsic value. It is a clean way to align the contract with the chart.
3. The expiration is part of the thesis. The August and September alerts shared a strike and a chart. The one with more time absorbed the October 5 test and was still alive for the breakout; the one with less time nearly went to zero first.
4. Respect the earnings calendar. The November contract runs through third quarter results, expected around October 20 to 21. Implied volatility often drops sharply after results, which can pull option prices down even when the stock moves the right way. Our breakdown on avoiding post-earnings IV crush explains the mechanics.
How PM Stacks Up Against Recent Alerts
PM’s +211% high was the sixth largest of the 24 alerts PPP published from August 18 to September 30. The scorecard shows the five above it and all eight that fell short of +50%, because a fair read of any alert service needs both lists.
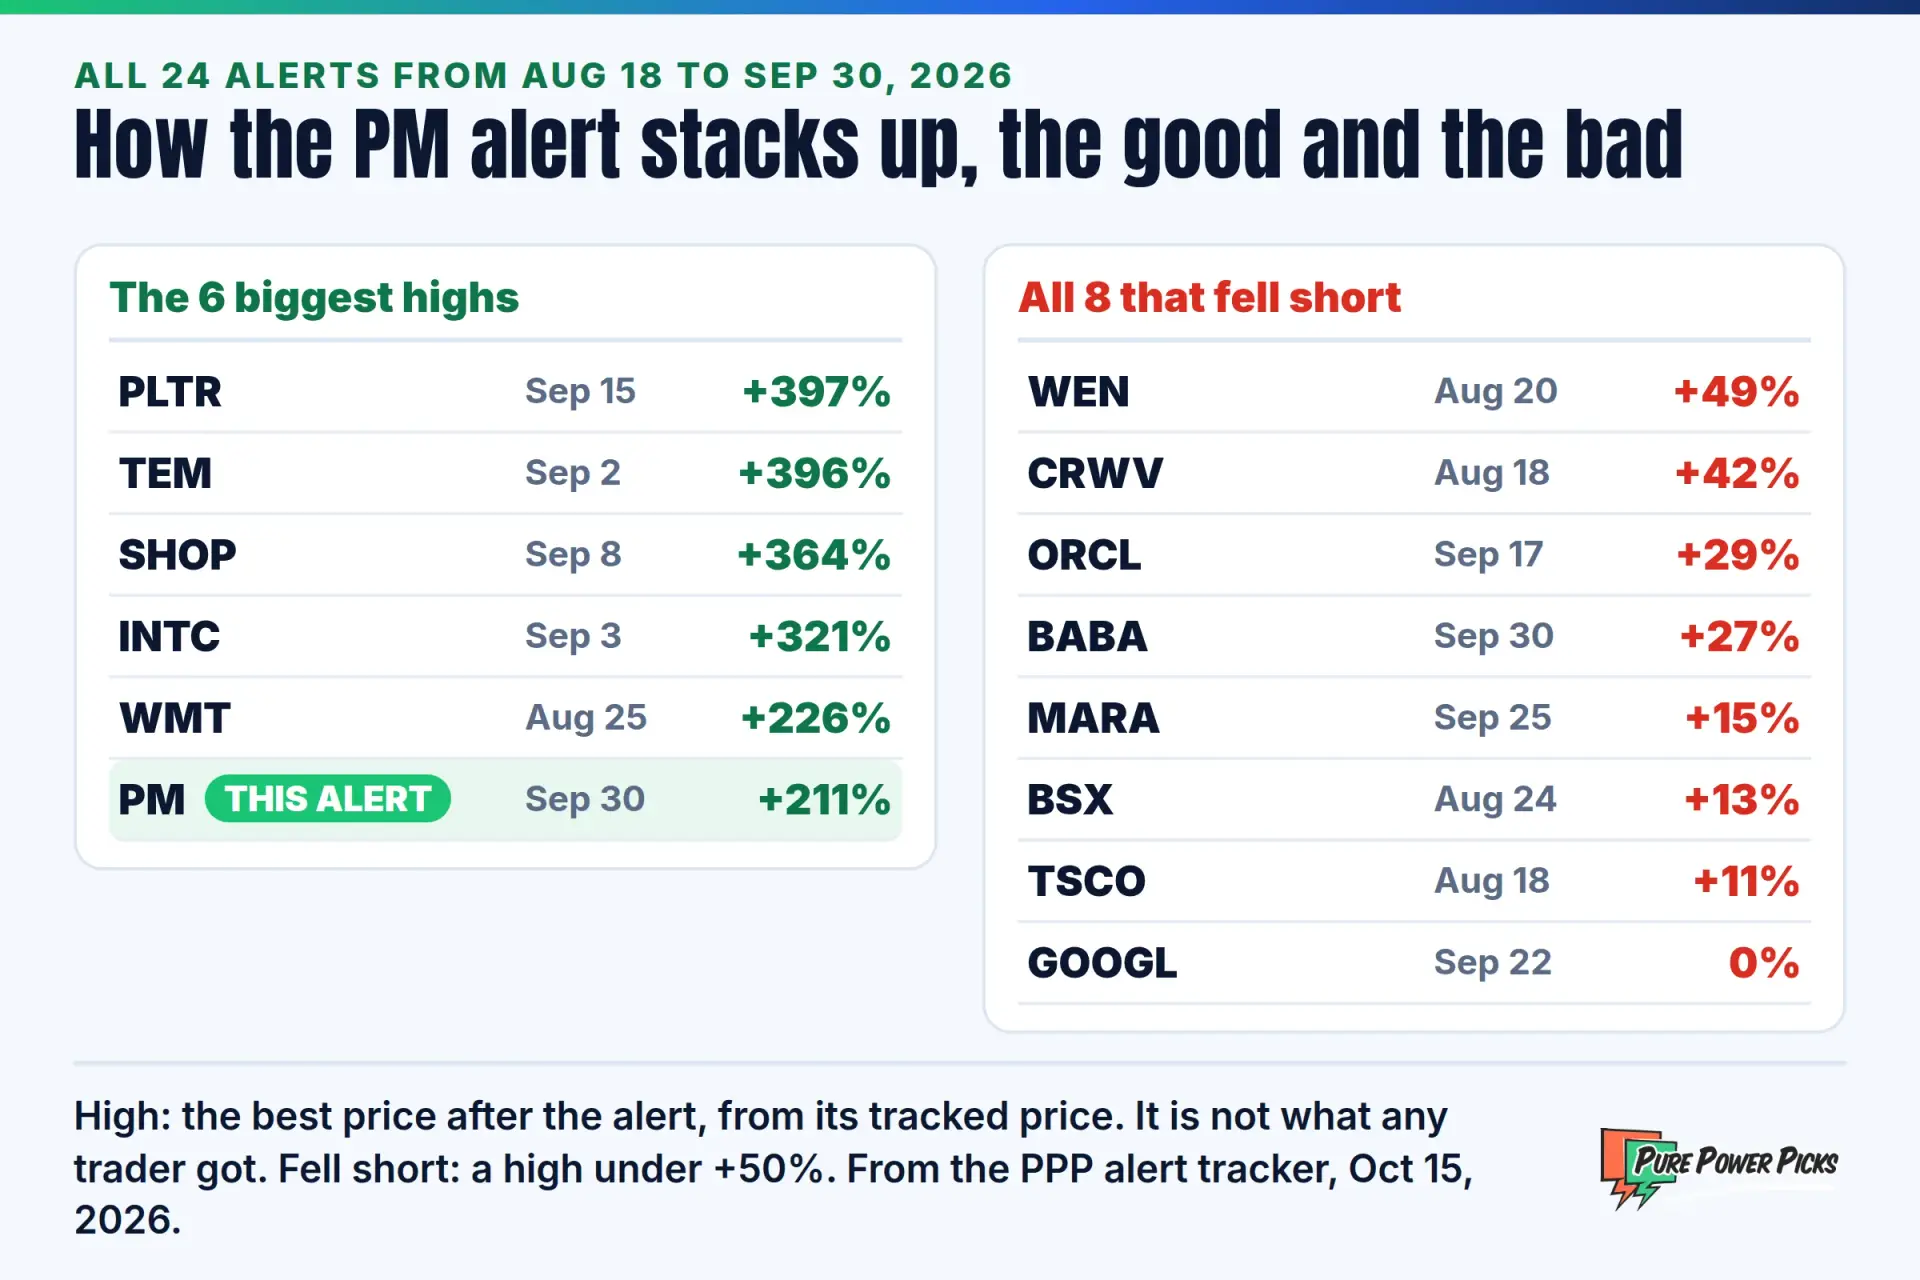
A high is the best price an alert reached, not what any trader got, and several of those big movers have since given much of it back. For more of both sides, read our QCOM and OKLO alerts breakdown, which puts a big mover next to a breakout that failed, or the UNP earnings options alert case study.
Frequently Asked Questions
What was the PPP alert on PM?
PPP alerted PM $200 calls expiring November 20, 2026, at $4.70 on September 30, 2026, at 2:59 PM ET, with the stock near $191. The contract reached a high of $14.60 on October 15, or +211%.
Was PM on the PPP watchlist before the alert?
Yes. PM was on the weekly watchlist published August 23, 2026, with a breakout trigger at $194.26 and targets up to $225. PPP also alerted PM October 16 $200 calls on August 26, which reached a high of +82% the day before expiration after falling as low as $0.33.
What is the void level on this alert?
The void is $183.50: a daily close below it invalidates the thesis. PM came within 61 cents of it on October 5, with a low of $184.11, and never closed below it.
Why did the option drop 28% on October 15?
PM opened at a record $210 and reversed to close at $199.90. That $10 slide from the open took the call from its $14.60 high to a $7.90 close, still +68% from the alert price. Options move faster than the stock in both directions.
Every PPP alert comes with a detailed thesis, price targets, support/resistance levels, and a void level: the full roadmap, not just a ticker.
Disclaimer: Pure Power Picks is not a licensed financial advisor. All content is for educational and informational purposes only and should not be considered investment advice. Options trading involves substantial risk of loss and is not suitable for all investors. Past alert performance does not guarantee future results.
Share

The PPP Team is the research and editorial team behind Pure Power Picks. We trade stocks and options and publish the work as we do it, with every alert tracked in public. Publishing since 2020. How we research and correct our work is written out in our editorial standards. Our content is strictly educational, never advice.