


Stocks To Watch – 8/23/2026
The information provided in this Weekly Stocks to Watch list is for educational and informational purposes only. It should not be considered financial advice, investment recommendations, or a solicitation to buy or sell any securities. Trading and investing involve significant risk, and you should only trade with money you can afford to lose. Always conduct your own research or consult with a licensed financial advisor before making investment decisions.
It's Free Watchlist Week! Once a month we send the entire Watchlist to everyone for free.
If you're not yet a member, Sign up now and get every Watchlist, every week! You will also receive the Pure Power Picks 3-5 Weekly Options Trading Alerts & much more!
Past performance does not guarantee future results. Options trading involves substantial risk of loss. Percentage shown reflects the maximum opportunity the contract reached since the time it was alerted and does not represent the active value of the alert at this time.
Weekly Market Brief
Last Week in Review:
Markets shifted into a risk-off posture during August 17–21 as rising Treasury yields, persistent inflation concerns, and escalating Middle East tensions pressured valuations, leaving the S&P 500 down 1.4%, the Nasdaq off 2.1%, and the Dow lower by 0.9%. Hawkish July FOMC minutes reinforced the higher-for-longer narrative by showing that many policymakers could support additional tightening if inflation remains elevated. Retail earnings produced a mixed consumer signal, with Walmart’s outlook weighing on sentiment while select off-price names showed better resilience. The dominant theme was a bond-driven rotation away from rate-sensitive technology and toward financials, healthcare, commodities, and other value-oriented areas, even as Friday’s rebound softened the weekly damage.
Week Ahead — What to Watch:
Tuesday, August 25 brings consumer confidence, new-home sales, home-price data, and the Richmond Fed manufacturing index, offering an early read on household demand and economic momentum. Wednesday, August 26 is the week’s first major volatility window, with July PCE inflation, the second estimate of second-quarter GDP, durable-goods orders, and Nvidia earnings after the close. Nvidia’s results, along with reports from Salesforce, CrowdStrike, and Synopsys, will test whether the AI and software trades can regain leadership after the prior week’s technology pullback. Thursday’s calendar includes jobless claims and earnings from Dollar General, Dollar Tree, Best Buy, Marvell, Workday, and Ulta, while the Jackson Hole symposium begins and geopolitical developments involving Iran remain a potential catalyst for oil, yields, and inflation expectations. Fed Chair Kevin Warsh’s Jackson Hole address at 10:00 a.m. ET on Friday, August 28 could determine whether the market extends its rotation or reaches a broader inflection point, making elevated volatility the most likely setup for the week.
SPY Market Brief
SPY remains in a broader uptrend, but this week’s rejection from $776.78 puts near-term resistance at $776-$777, with support clustered around $762 and the $752-$751.75 area. The ETF opened at $776.18 and closed at $765.72, declining 1.35% from the weekly open while remaining above the $751.75 50-day SMA and $707.54 200-day SMA throughout the week. Monday’s rejection led into Tuesday’s 0.68% decline; Wednesday gained 0.21% close-to-close despite finishing below its opening price, Thursday dropped 0.84% to the weekly low, and Friday produced a 0.41% rebound. The tone is corrective and choppy rather than structurally bearish, so swing traders should anchor positioning to $762 support and $776.78 resistance.
SPY remains above the $752 10-week SMA and $708.86 40-week SMA, while the weekly RSI of 63.08 reflects positive momentum without reaching an extreme. The $739-$752 region is the primary multi-week support zone, followed by the June low near $716.58 and longer-term support around $708.86. Elevated oil prices and Middle East supply disruptions are sustaining inflation concerns, while Federal Reserve officials have indicated that higher rates may be necessary if inflation remains persistent. Tariff and sanctions uncertainty adds another source of risk, but the weekly candle still looks like a pullback within an established uptrend unless $752 breaks decisively.
Bullish Perspective
The bullish case remains intact while SPY holds $762 and, more importantly, the $752-$751.75 confluence of the 10-week and 50-day averages. A reclaim of $769-$772 would show that buyers are absorbing the week’s selling pressure and set up another test of $776.78. A weekly close above $776.78, supported by stronger market breadth, would confirm renewed upside momentum and a likely continuation of the larger trend. Easing oil prices, reduced geopolitical tension, or softer rate expectations would strengthen that setup.
Bearish Perspective
Bears gain traction if rebounds repeatedly fail in the $769-$772 area and SPY closes below the weekly low at $762.04. That breakdown would expose the $752-$751.75 support cluster, where failure would represent a more meaningful shift in the daily and weekly structure. Below that zone, $739-$741 becomes the next downside target, followed by $716.58 and the $708.86-$707.54 long-term support area. Persistent energy inflation, tighter rate expectations, escalating sanctions or tariffs, and deteriorating market internals would confirm the bearish thesis.
 Source: TradingView
 Weekly Stocks to Watch
Boston Scientific
BSX has been building a potential reversal and has climbed 17% from the lows this past month, back over the weekly 13ema and now wrestling with the $50 psych level. Last week it hit $52.99 and got knocked back into $49.01 before closing green. Resistance is $52.34 – $52.99. Support is $49.01 – 45.17. If bulls take $53 and hold, look for $55, then $59 and with time a run into $64 – 66. There's a lot of upside supply above that if BSX can turn bullish. If $49 gives way, watch $45.17 – 43.58 – 41
 Source: TradingView
 Walmart
Huge downside candle on 8/20. WMT gapped from $114 straight into the $102.85 low and closed last week on the lows at $103.70. Based on last week, WMT might see downside continuation. Support is $102.15 – $100. Resistance is the gap at $106.38 – $107. If $102.15 does not hold, watch downside into $100 psych level. If $100 breaks, then $97.50 – $95.42 52wk low are solid downside targets. If bulls reclaim $107 and hold, a gap fill push into $110 – $113.99 – last week's high 116.87 is on the table.
 Source: TradingView
 Tempus AI
TEM went vertical last week, ripping from the $49.35 low on 8/18 into Friday's $72.96 high and closing on the highs. That's three sessions and it leaves price stretched way above the 13ema, so chasing here carries real risk. Resistance is $76 range, support is the $68.60 – $61.46 demand shelf. If bulls clear $76 and hold, look for $78.29 – $80.27, with time a push back toward $90 – 97 – 100 – 104.32. If TEM cools off, $68.60 is the first shelf, then $66.65 – $61.46. Losing that opens the gap back to $52.97. Earnings 10/29.
 Source: TradingView
 Philip Morris International
PM, weekly chart ascending and getting tight, looks like could see an upside breakout with time. PM hit $194.26 on Wednesday and faded right back, closing the week at $188.23. Still holding the weekly 13ema. Support is $186 – $184. Short term resistance is $190 – $194.26. If price clears $194.26, look for $197.50 – $200. With time a run back at the $207.76 52wk high. Over that there's no supply and PM could run up into $210 – 225+ before a meaningful pullback. If $184 fails watch for $180, then the $175 area.
 Source: TradingView
 Carrier Global
CARR has bled lower for two straight weeks and is now sitting at the $60 level. This is a name we want to watch for a bounce off demand. Support/demand is $59.90 – $57.7. Resistance is $62.41 – $64.73. If $60 holds and bulls reclaim $62.41, look for a push into $64.73, then $67.30, and with time the $70.50 – $73 supply. If $57.69 gives way, watch for a slide into $55 – $53, with the $50.36 double bottom area the deeper demand.
 Source: TradingView
 Adobe
ADBE is setting up as a potential bullish trend reversal play after beginning its reversal on Jul 1st, recently breaking above its 200 SMA and seeing a consolidation breakout near $273.50. Look for a sustained move above $275.80, for upside targets at $277.05 – 277.10 (Friday’s HOD) – 279.50 – 282.30 – 284.06 – 285.40 – 290 – 291.30. If we see a sustained break below the $255 consolidation area, look to possible downside targets at $252.60 – 251.20 – 250.40 – 245.50 – 244.30. Earnings are scheduled for Sep 10th after hours.
 Source: TradingView
 Toast
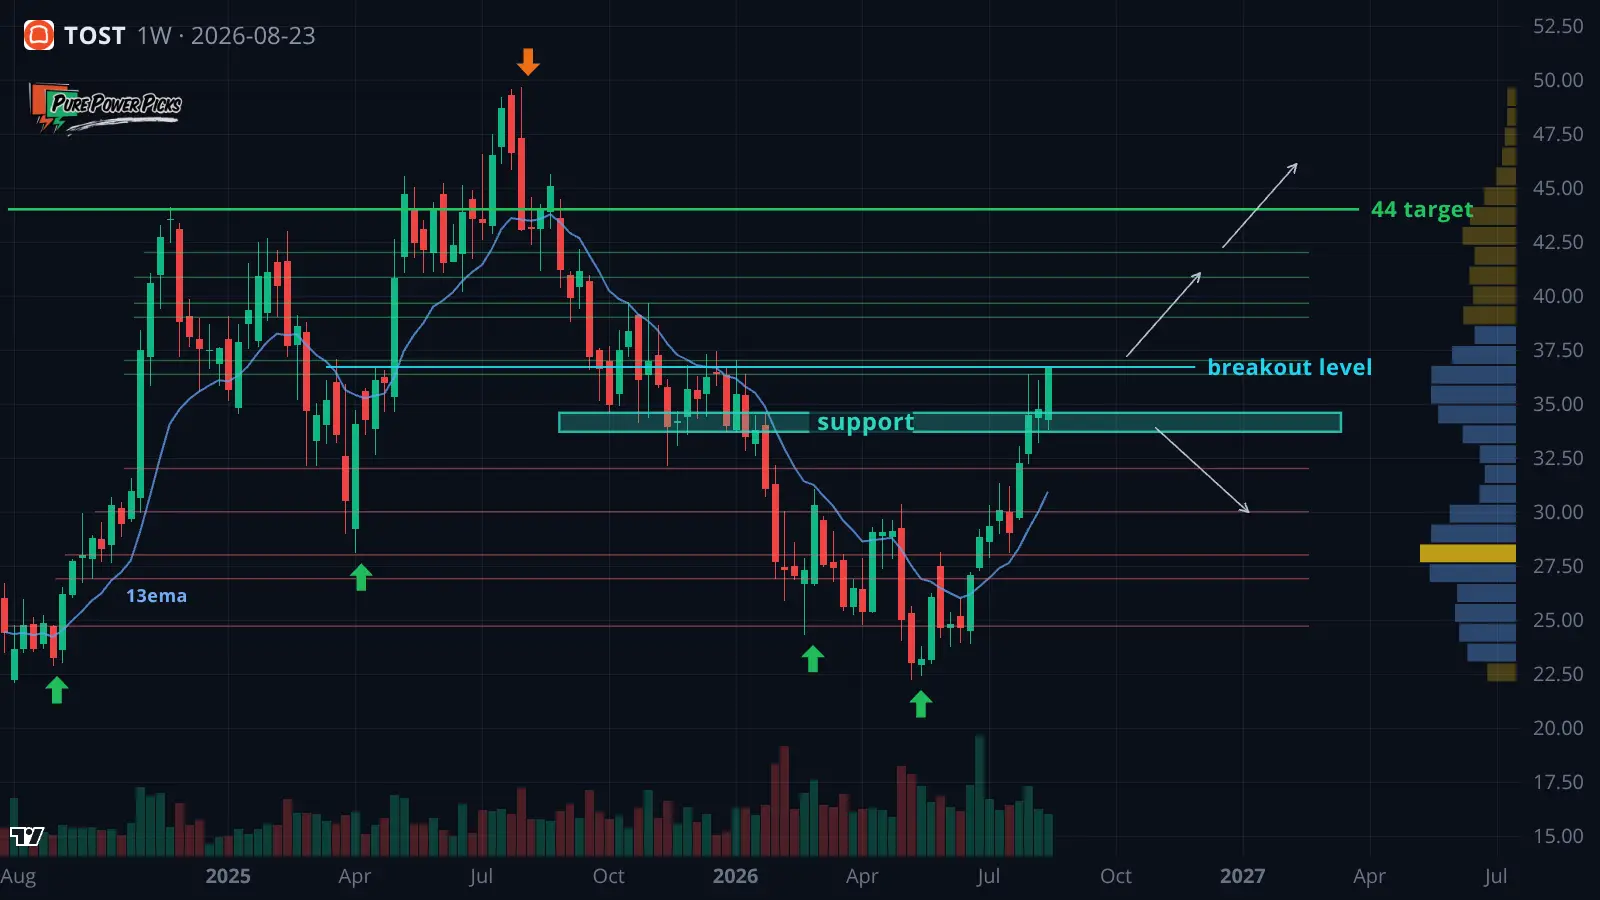
TOST is setting up as a potential continuation play after breaking out above the $36.36 area, clearing strong resistance and a 12-day consolidation range. Zooming out, TOST has also broken out of a 7-month inverse head & shoulders pattern, adding higher-timeframe confirmation to the bullish setup. Look for a sustained move above the $36.70 – 37 area, for upside targets at $39 – 39.65 – 40.85 – 41 – 42 – 43.79 – 44. If we see a sustained break below the $33.70 consolidation area, look to possible downside targets at $32 – 30 – 28 – 26.90 – 24.70. Dark pool activity was detected between Aug 12th – 17th, with roughly 3.2M shares traded in the $33.59 – 34.58 range.
 Source: TradingView
 Continued Watch
“GLD has run about 10% off the $368.64 low in two weeks and stalled right on the $400 level, closing the week at $401.48. Zoom out and this is still a bounce inside a weekly downtrend off the 2026 highs. Use support $400 – 395 for a strong risk reward. If $400 is holding and last week's $407.36 high is broken, target $415 – 421.82 – $425 – 436, with time a push back toward $448.7. If $395 does break, watch for downside risk into $389.64 – 384 – $374.16, potentially the $368.64 low. Gold price must be moving up for this idea to flourish.”
“Potential for a pullback. A lot of upside wicks have formed on DDOG weekly chart, and two weeks ago, a large bearish engulfing. Look for resistance $255 – 263 short term. Any move over this and DDOG can continue to burn shorts and move into $275 – 300+ quickly. However, there's a lot of downside if the pattern fails. If last short term resistance is not broken, target downside $242 – 230 near term. With more time, and a break below $229.75 target 225 – 215 – 200. This could cause selling to heat up for deeper downside $193 – 180 – 165 – 160 with time.”
“MU dipped into $770.10 at the start of the month and has climbed straight back, reclaiming the daily 13ema and closing last week at $971.66 just off the $984 high. This is a pullback inside a bigger uptrend until it proves otherwise. If bulls take $984 and hold, look for $1000 psych, then $1050 – 1100, and with time the $1255 weekly swing high is on the table. If $950 gives way, watch $900 for buyers. Lose that and $861 – 829.50 comes back into play. Earnings 9/21 is the fork.”
“QMCO went vertical last week, ripping from the $11.78 area on 8/11 all the way into Thursday's $27.80 high. That is a parabolic move and price is stretched far above the 13ema, so chasing here carries real risk. Resistance is $27.80 and the $30 psych level. Support is $21.93 – $19.40, with the breakout gap down at $12.45 – $11.78. If bulls clear $27.80 and hold, look for $30.70 and with time a push into $33 – $36 – 38 – 41. If it rolls over, $21.93 is the first shelf, then $19.40. Losing that opens the gap back up.”
“DASH is setting up for a potential bullish momentum continuation with a new bull flag forming after its previous bull flag breakout near $204 on Aug 3rd. As long as DASH can remain above the $216.26 – 217.02 resistance area (Friday’s close), look for upside targets at $218.00 – 219.50 (Friday’s HOD) – 220.85 – 222.35 – 223.15 – 225 – 226 – 228.30. If we see a sustained break below the $206.25 – 206.00 area (Aug 11th low), look to possible downside targets at $204.90 – 203.25 – 202.30 – 201.43 – 199.00. Recent analyst upgrades also support the bullish setup, with price targets of $230 from Piper, $250 from Susquehanna, and $260 from Cantor.”
“DIS is setting up as a potential continuation play after Friday’s breakout above the $105.01 resistance area, a level previously tested on May 27th and Aug 7th, along with a reversal doji / trend reversal that was confirmed above $103.70 on Aug 13th. If DIS can hold above $107.11, look for upside targets at $108.35 – 110.50 – 112.00 – 114.75 – 115.96 – 117.05 – 119.00 – 119.78 – 120.86. If we see a sustained break below the $102.00 doji low (bull flag support), look to possible downside targets at $101.00 – 99.80 – 98.50 – 98.11 – 97.25 – 96.60. Prior resistance / consolidation areas that could now act as support.”
Earnings Calendar
 Source: Earnings Whispers
 Economic Calendar


