


Stocks To Watch – 10/18/2026
The information provided in this Weekly Stocks to Watch list is for educational and informational purposes only. It should not be considered financial advice, investment recommendations, or a solicitation to buy or sell any securities. Trading and investing involve significant risk, and you should only trade with money you can afford to lose. Always conduct your own research or consult with a licensed financial advisor before making investment decisions.
It’s Free Watchlist Week! Once a month we send the entire Watchlist to everyone for free.
If you’re not yet a member, Sign up now and get every Watchlist, every Week! You will also receive the Pure Power Picks 3-5 Weekly Options Trading Alerts & much more!
Past performance does not guarantee future results. Options trading involves substantial risk of loss. Percentage shown reflects the maximum opportunity the contract reached since the time it was alerted and does not represent the active value of the alert at this time.
Weekly Market Brief
Last Week in Review:
Markets shifted decisively risk-off as hotter-than-expected September CPI and PPI data, combined with strong retail sales, revived concerns that the Fed may need another rate increase before year-end. The S&P 500 fell roughly 2% for its worst week since June, while the Nasdaq suffered its first weekly decline in five weeks as investors reduced exposure to semiconductors and other high-valuation AI leaders. Early bank and semiconductor earnings produced mixed reactions, with solid underlying demand often overshadowed by margin pressure, elevated expectations and concerns about debt-funded AI investment. Energy and defensive sectors outperformed as oil climbed on continued Middle East supply risks, making the dominant theme a rotation away from crowded growth trades and toward inflation-sensitive and lower-volatility groups.
Week Ahead — What to Watch:
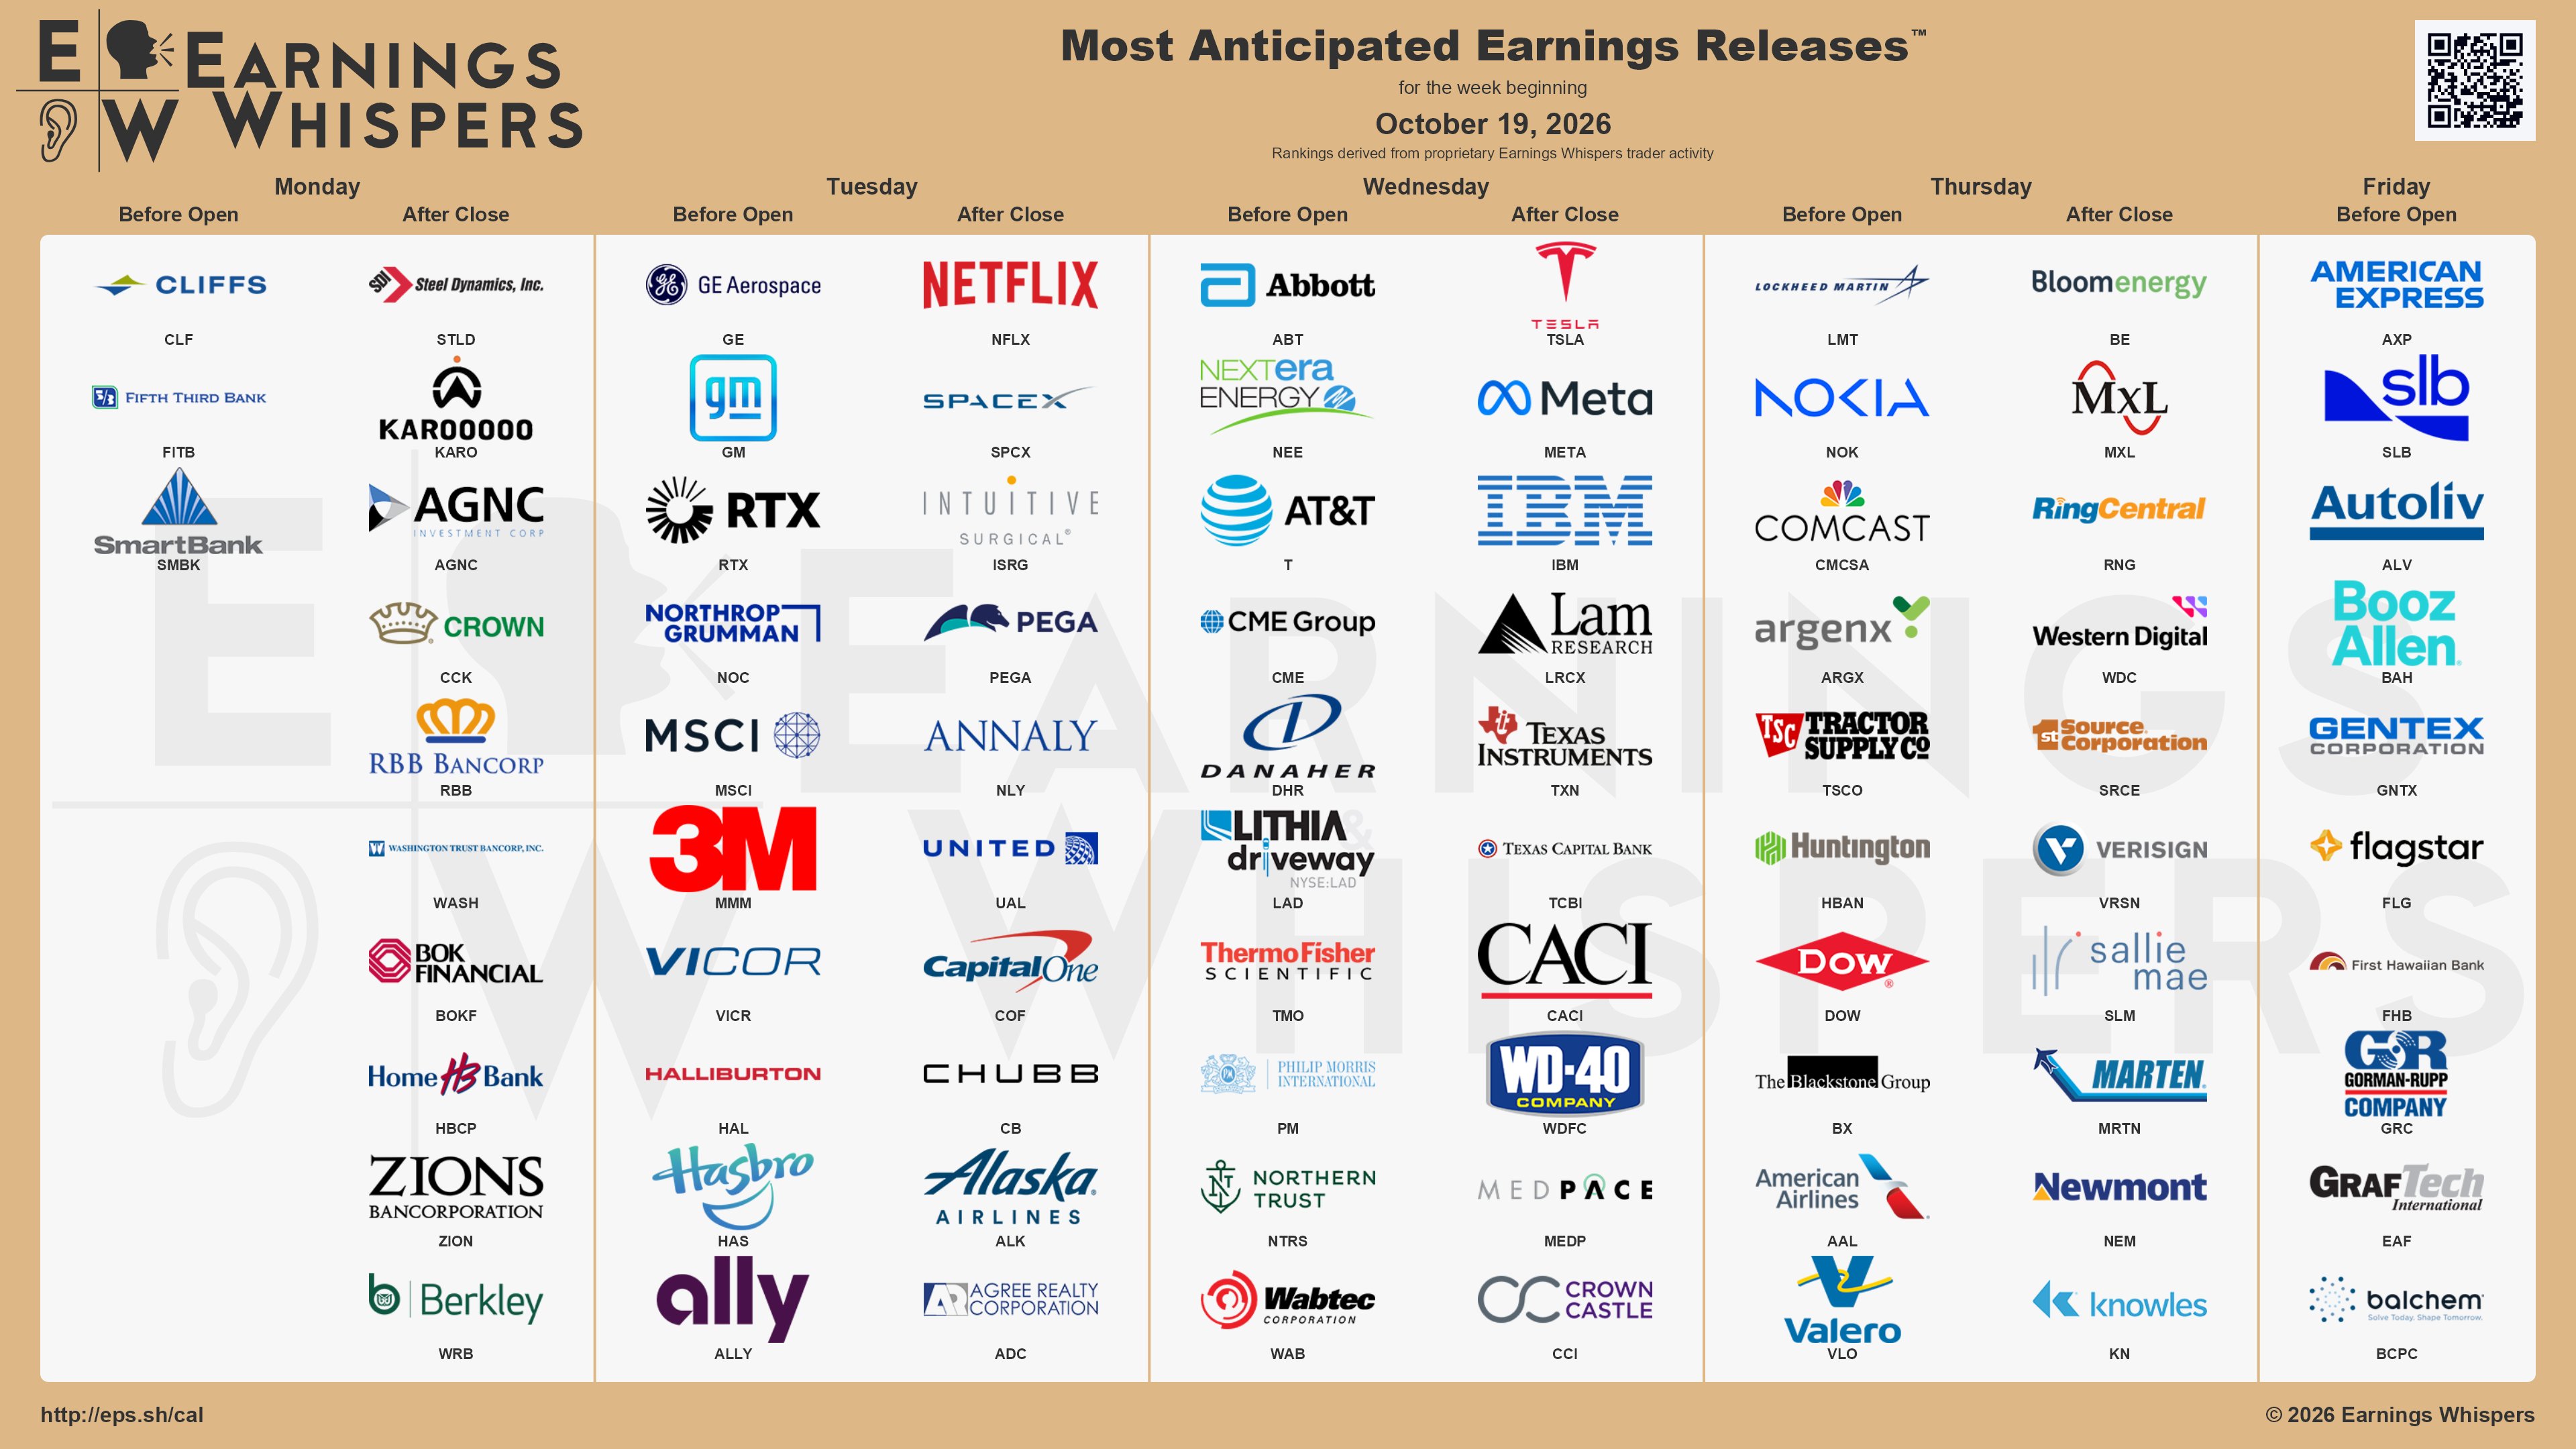
Earnings will take center stage, beginning Tuesday, October 20, with General Motors and Netflix, alongside the September housing starts report. Wednesday, October 21, is the critical session for growth stocks, with Meta, Tesla, IBM, Lam Research and Texas Instruments reporting after the close, while United Airlines provides another read on consumer travel and rising fuel costs. Thursday, October 22, brings results from Procter & Gamble, Union Pacific, Valero, Lockheed Martin, Spotify and Comcast, followed by American Express and SLB on Friday, October 23. The Fed enters its quiet period ahead of the October 27–28 FOMC meeting, leaving earnings guidance, weekly jobless claims and Friday’s final October consumer-sentiment reading to drive rate expectations. With technology leadership under pressure, oil elevated and several market-moving earnings clustered midweek, the setup favors continued volatility and a potential inflection point for the AI trade and broader sector rotation.
SPY Market Brief
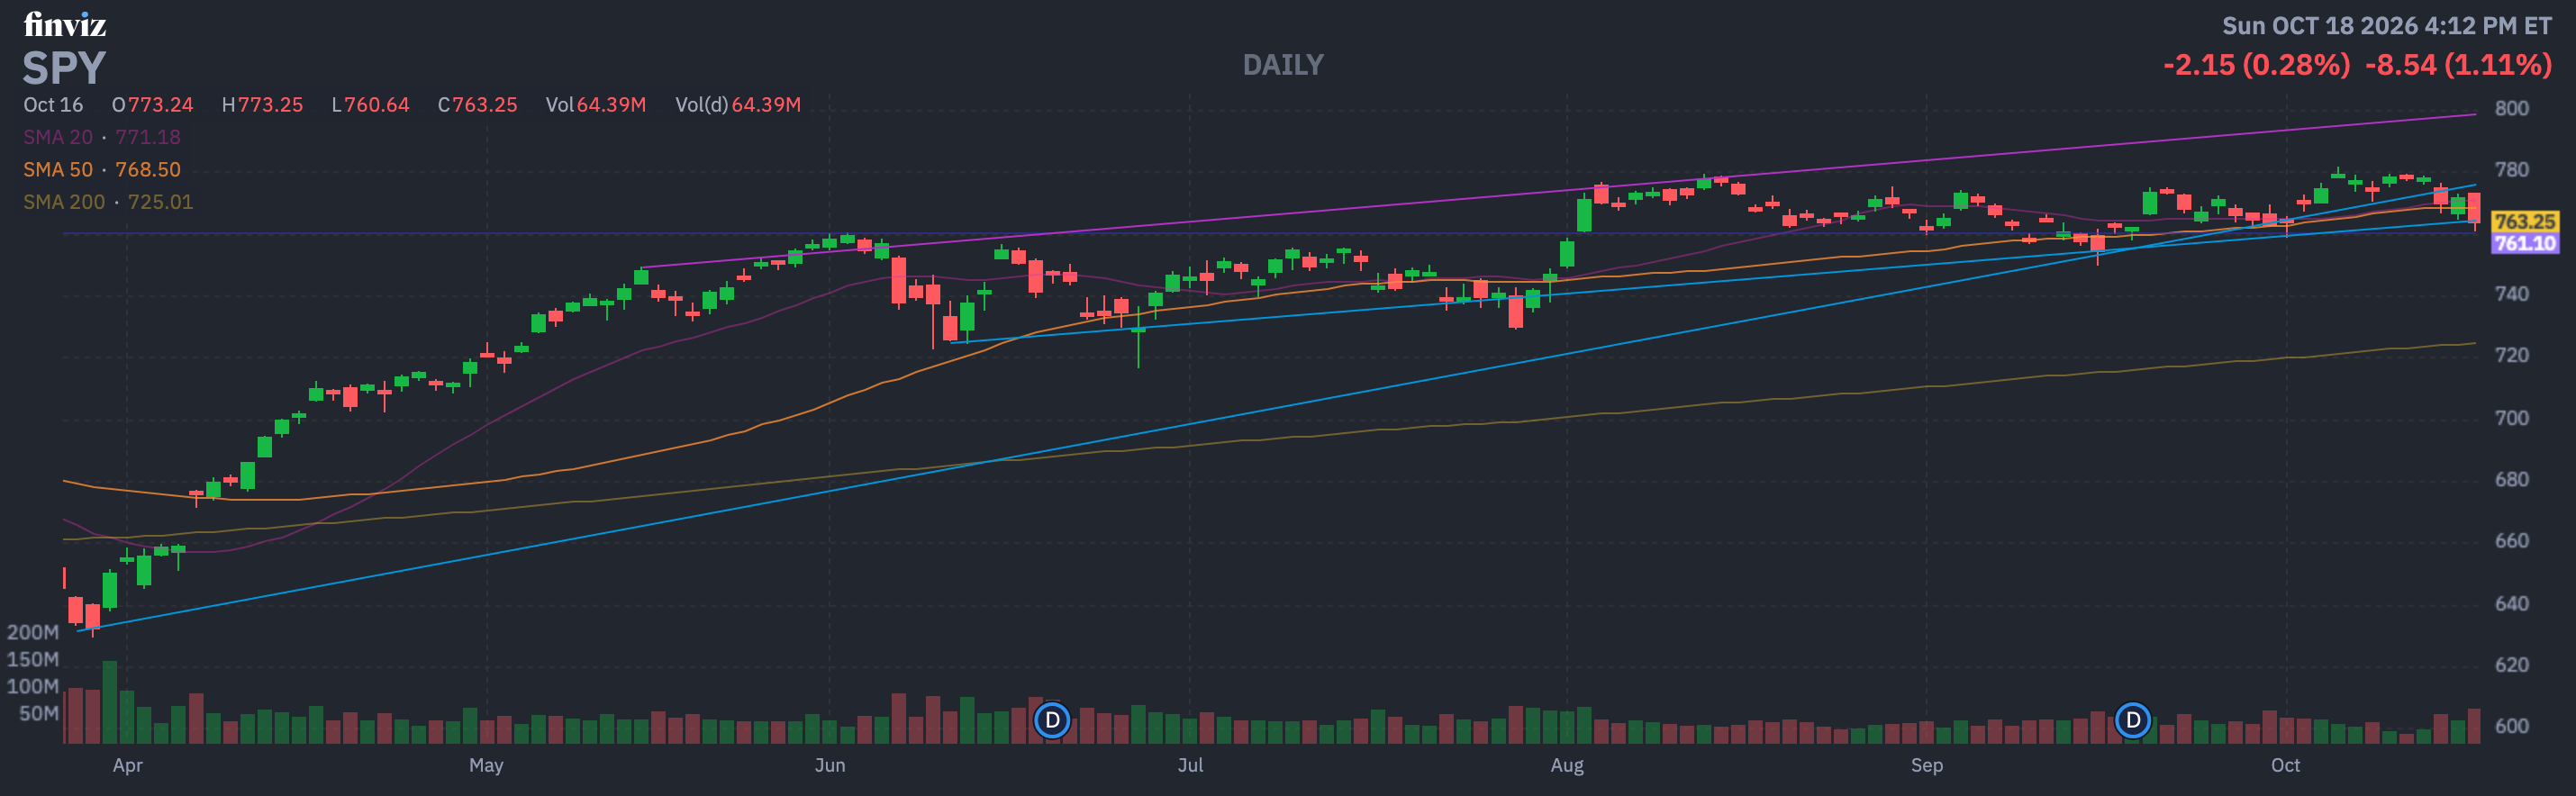
SPY’s broader uptrend remains intact above the 40-week SMA at $726.11, but the weekly close below the 10-week SMA at $769.04 signals a meaningful loss of near-term momentum. Key support sits at $760.64-$762.04, while resistance is layered at $768.50-$769.04, $773.25, and $778.75-$779.40. Across a full five-session week, SPY opened at $778.78 and closed at $763.25: Monday and Tuesday held firm, Wednesday broke lower, Thursday produced a partial rebound, and Friday’s $12.61 intraday range ended with a decisive selloff. Price remained far above the 200-day SMA at $725.01, but Friday’s close below the 50-day SMA at $768.50 leaves the short-term tone bearish for swing traders.
The August highs near $776.78-$779.37 have developed into a major supply zone, and this week’s rejection from $779.40 reinforces the risk of a broader range or corrective phase. SPY closed below the 10-week SMA at $769.04 but remains well above the 40-week SMA at $726.11, while the weekly RSI of 57.14 shows fading momentum without signaling a broken primary trend. Geopolitical supply risks and sanctions uncertainty have supported higher oil prices, increasing inflation pressure and complicating interest-rate expectations, while tariff uncertainty remains another potential headwind for margins and sentiment. The long upper rejection and close near the weekly low favor continued volatility unless buyers quickly reclaim the $769-$773 area.
Bullish Perspective
The bullish case rests on the primary trend remaining intact above the rising long-term support represented by the 40-week SMA at $726.11, with weekly RSI still holding above 50 at 57.14. Bulls first need to defend $760.64-$762.04, then reclaim the daily 50-day SMA at $768.50 and the 10-week SMA at $769.04. A close above $773.25 would strengthen the recovery, while a breakout through $778.75-$779.40 would confirm renewed upside momentum and invalidate this week’s rejection. Improving breadth, cooling oil prices, and reduced pressure from interest-rate expectations would add macro confirmation to that technical reversal.
Bearish Perspective
The bearish case is supported by Friday’s breakdown below the 50-day SMA at $768.50, the weekly close below $769.04, and a daily RSI of 43.57 that reflects deteriorating momentum without being oversold. A decisive break below $760.64-$762.04 would confirm that the August support area has failed and expose the market to a deeper correction toward the long-term moving-average zone. Bears would gain additional control if rebounds stall beneath $768.50-$769.04 or fail near $773.25, creating a lower-high structure beneath the $778.75-$779.40 ceiling. Continued technology weakness, elevated oil, renewed rate pressure, or deteriorating market internals would reinforce the downside setup.
 Source: TradingView
Weekly Stocks to Watch
CrowdStrike
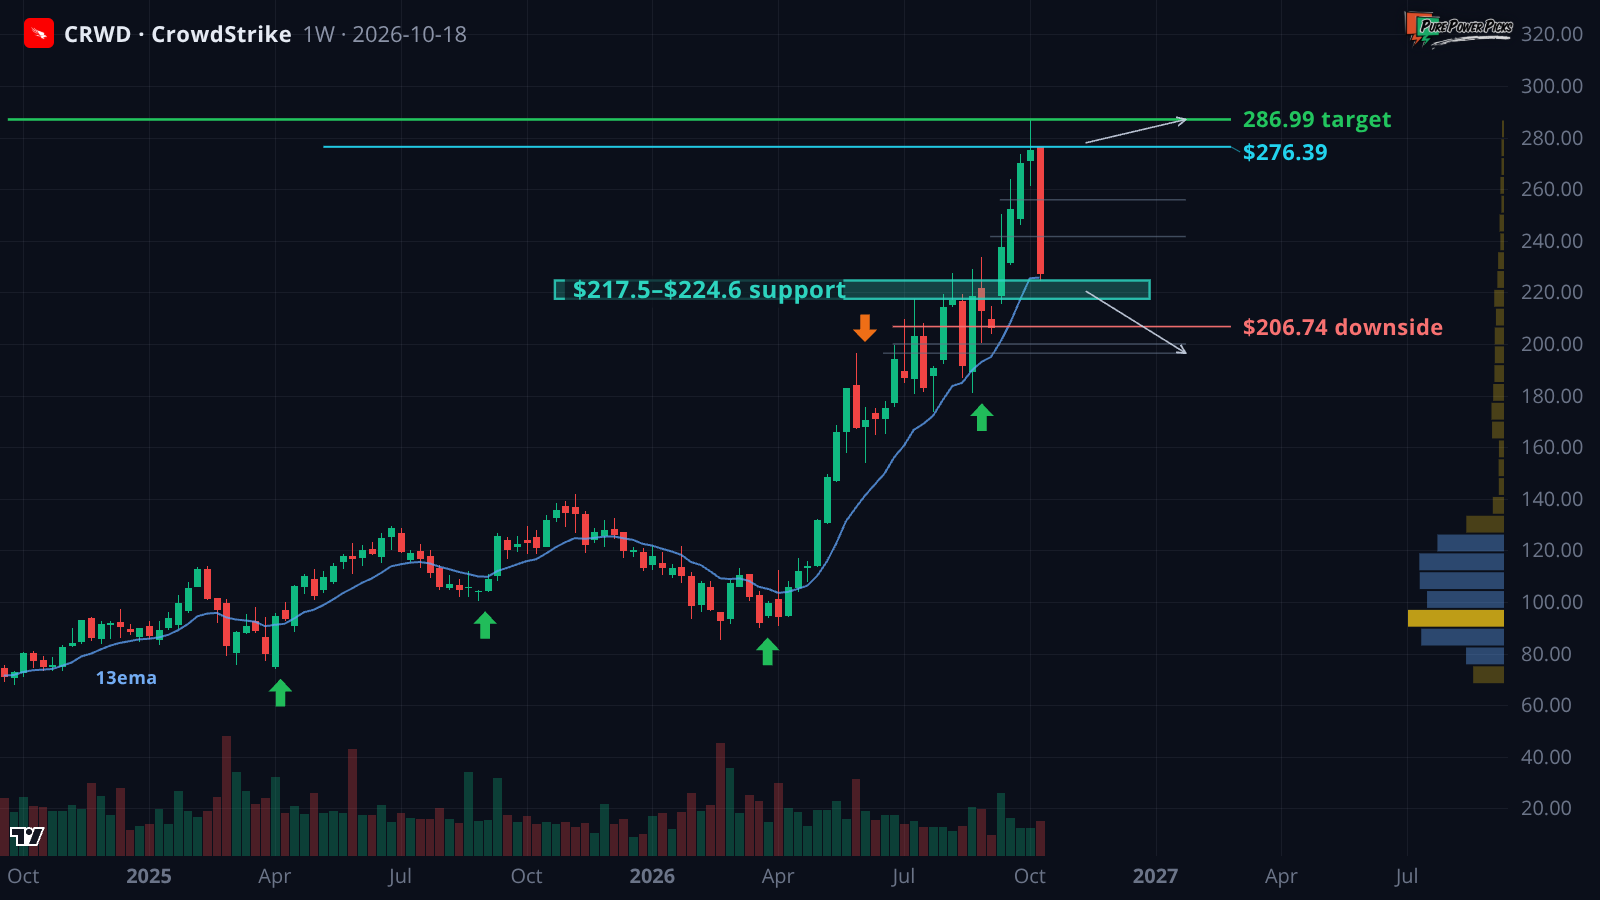
Huge downside candle Friday. CRWD dropped from $246.98 into $224.60 on about 1.7x volume and closed the week at $227.39, right on the weekly 13ema. That line has been the trend reference all year, so this is the spot. Support is $224.60 – $217.50, then the September gap at $219.00 – $206.74 and the $200 psych level. Resistance is $241.63 – $255.87, then $276.39. If $224.60 holds and price clears $241.63, look for $255.87, then a push back at $276.39, with the $286.99 high in the cards if the trend really plays out. If $224.60 gives way, watch $217.50, then the gap into $206.74 and $196.42. Earnings 11/30. Keep it simple – the weekly 13ema is the line.
 Source: Pure Power Picks
ExxonMobil
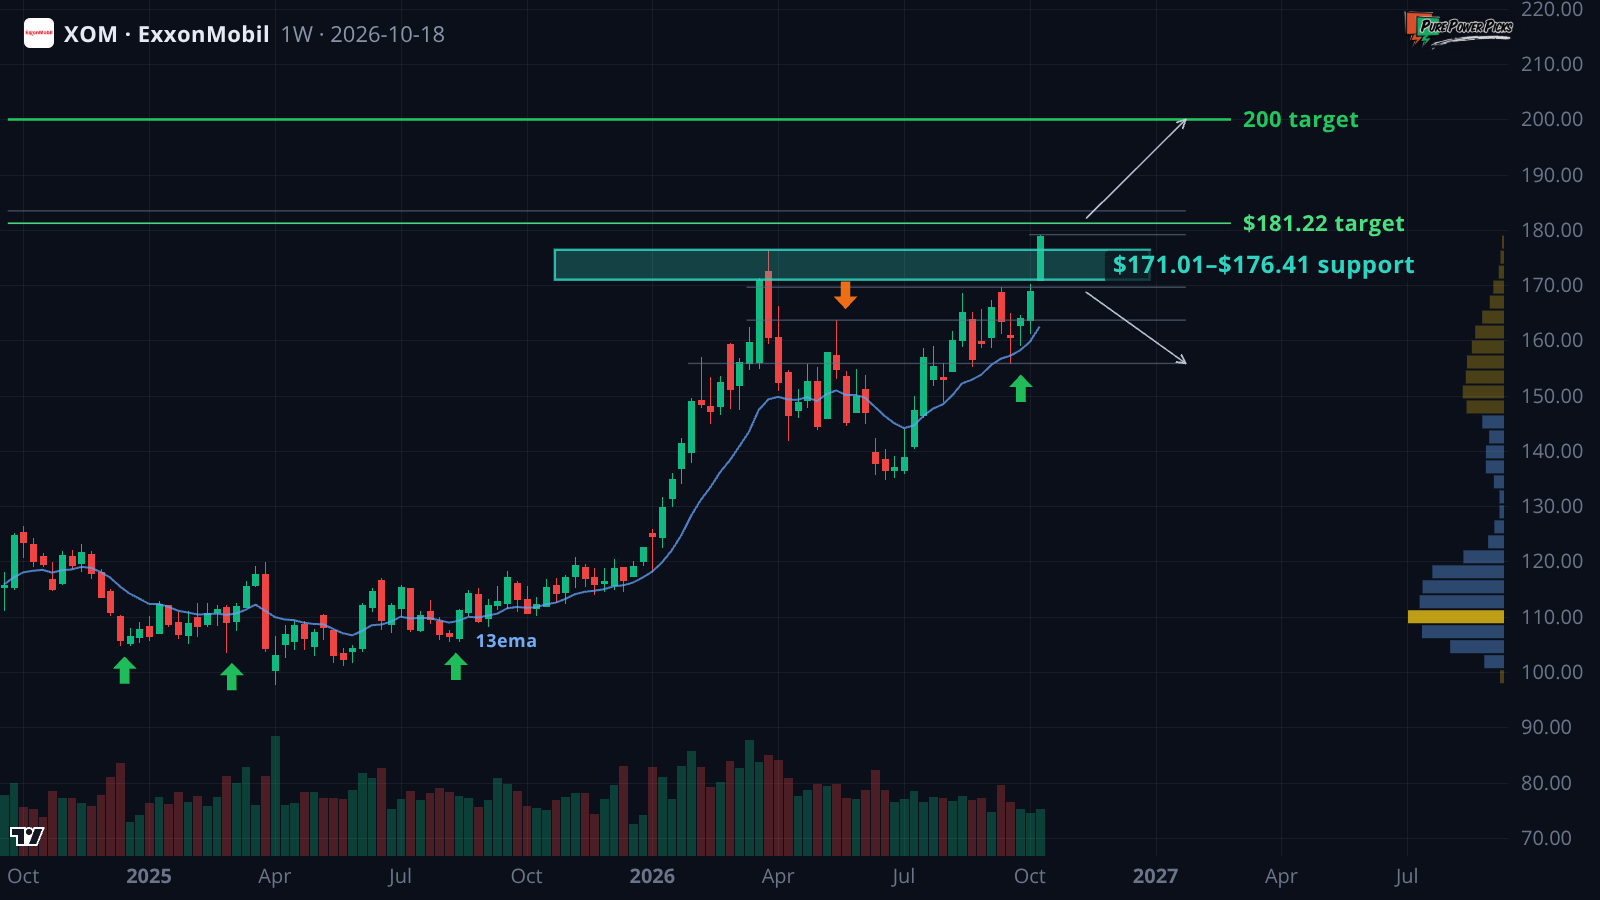
XOM has run better than 20% in three months and closed last week at $178.98, right on the 52-week high at $179.16. That's a leader coiling at the highs with price well above the weekly 13ema. Support is $176.41 – $171.01, then $169.64 and the $163.68 shelf. Resistance is $179.16 – $181.22, then $183.46. If $171.01 holds and price clears $179.16, look for $181.22, then $183.46 and the $180s above it. Clear that in the coming weeks – months and the $200 psych level is the bigger picture objective. If $171.01 gives way, watch $169.64, then $163.68 and $155.85 longer term. Earnings 10/23. Keep it simple – $179.16 and $171.01 are the lines.
 Source: Pure Power Picks
Rocket Lab
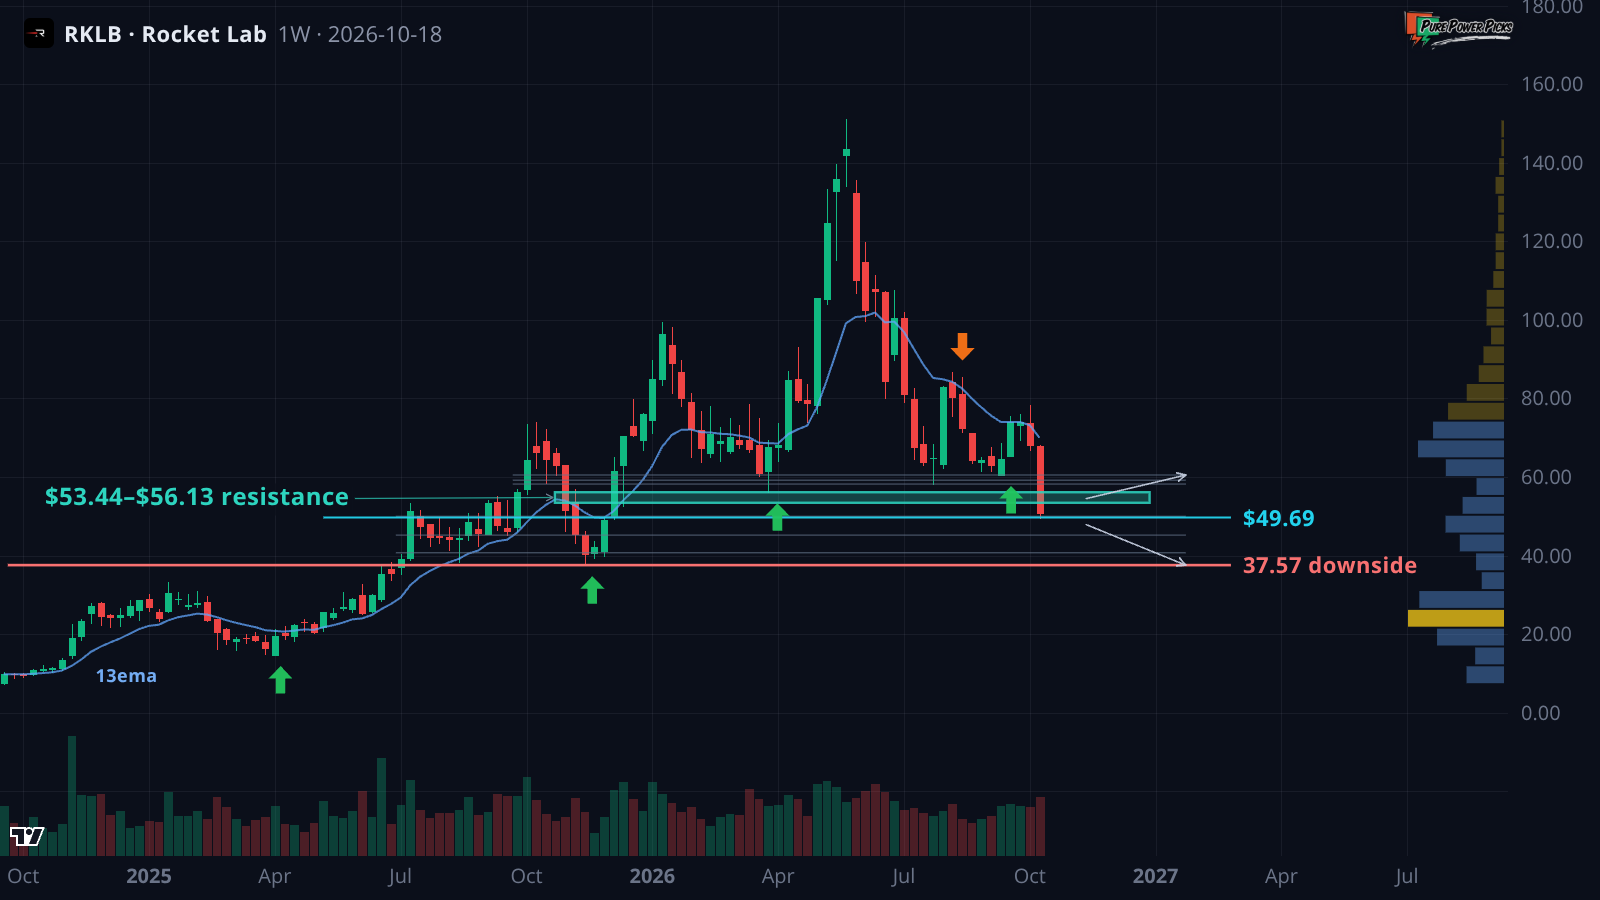
RKLB fell apart last week, gapping down from $59.18 into $49.69 on better than 2x volume and closing Friday at $50.84, right on the $50 psych level. The EMAs are stacked bearish and price is well under the weekly 13ema. Support is $50 – $49.69, then $45.21. Resistance is $53.44 – $56.13, with $58.20 and the gap top at $59.18 overhead. If $49.69 gives way, watch $45.21, then $40.73, and if the downtrend really plays out the $37.57 low comes back into play over the coming months. If price reclaims $53.44 and holds, $56.13 opens up, then $58.20 and the gap fill into $59.18 – $60.51. Earnings 11/9.
 Source: Pure Power Picks
AST SpaceMobile
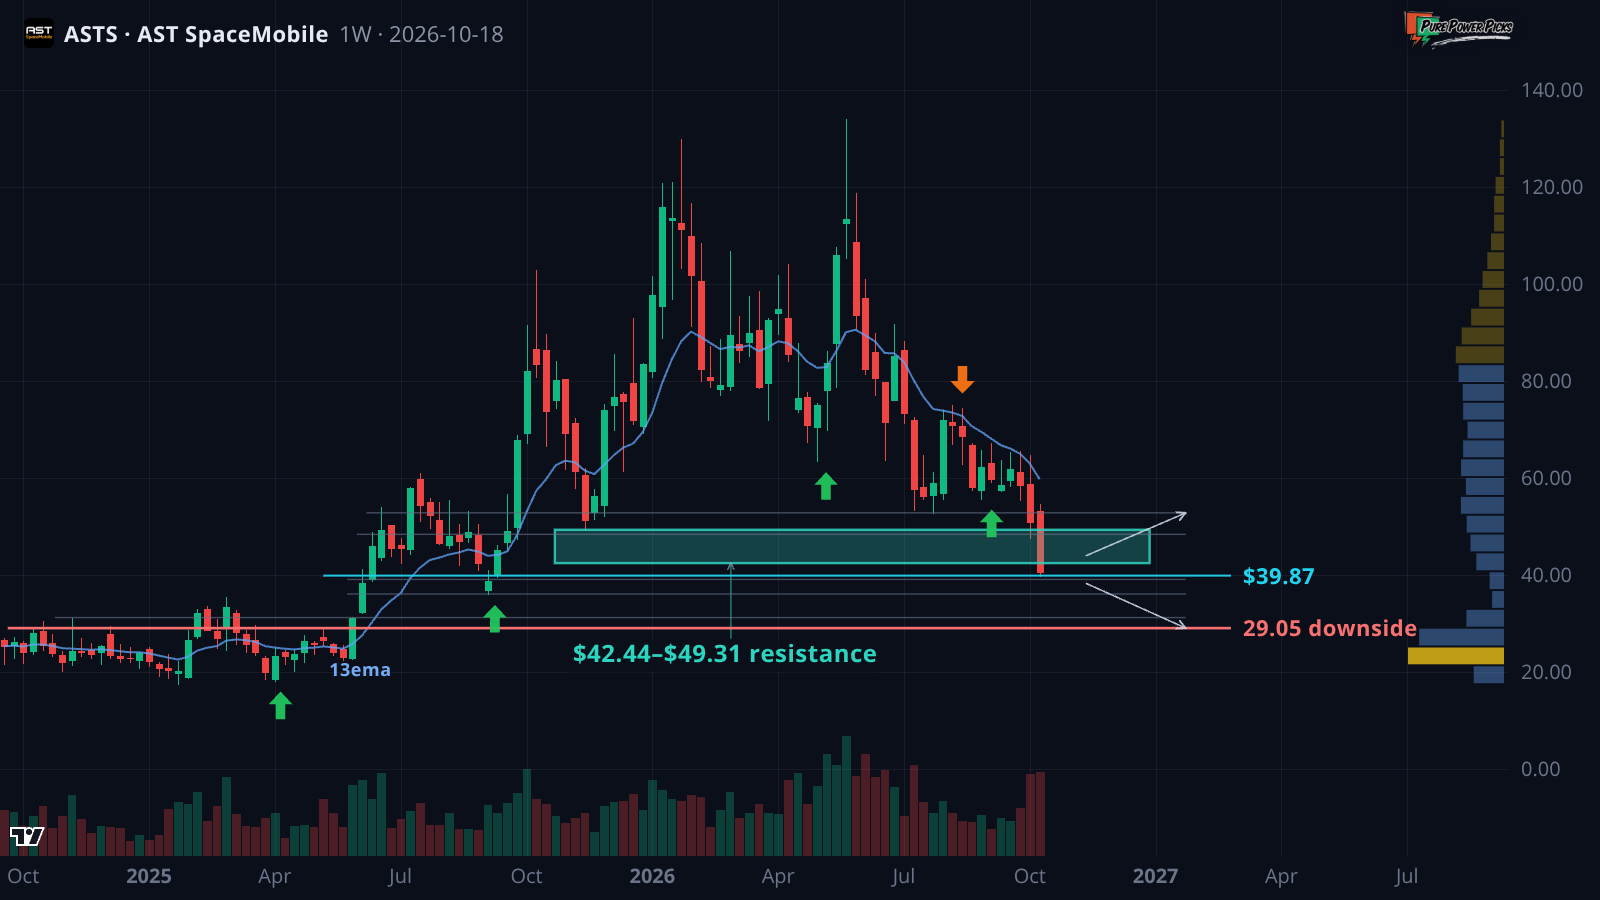
ASTS has been falling apart for a month, down better than 35% and closing last week at $40.66 right on top of the $39.87 52-week low. The gap down from $51.46 into $48.37 on 1.6x volume is still open overhead, and the EMAs are stacked bearish. Resistance is $42.44 – $49.31, then the $52.80 shelf. Support is $39.87 – $39.08, then $36.08. If $39.87 gives way, watch $39.08, then $36.08 and the $31.22 area, with $29.05 on the table in the coming months. November has been the weak month here, 1 of 5 years up. If price reclaims $42.44 and holds, the gap zone into $49.31 comes back into play, then $52.80 with time. Earnings 11/9.
 Source: Pure Power Picks
HP
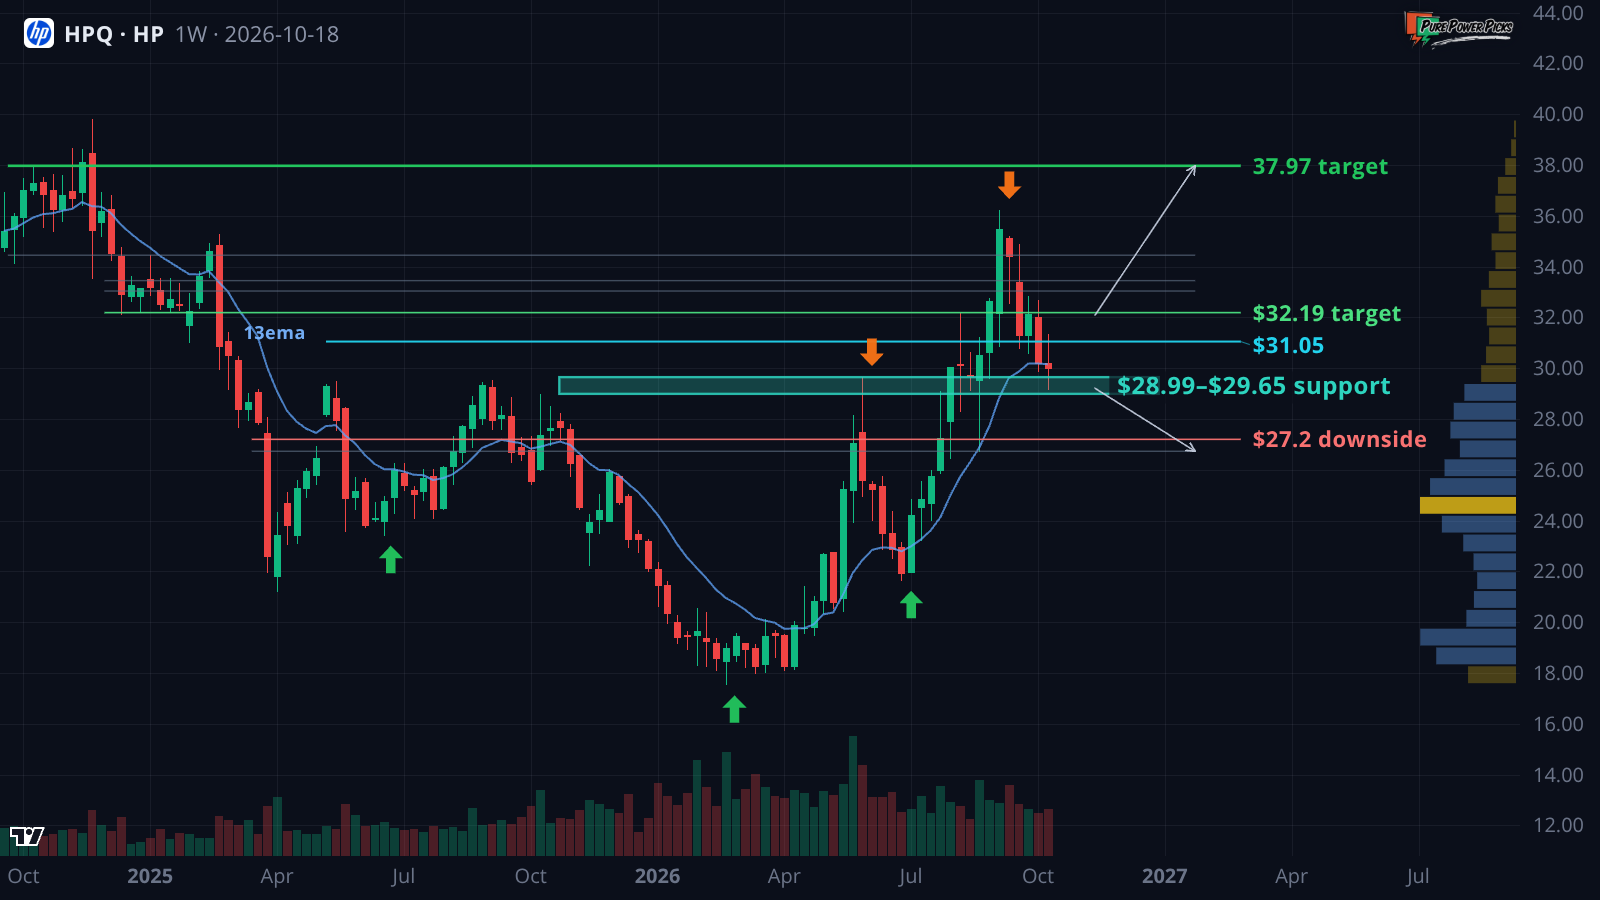
HPQ faded from $32.67 on 10/6 and spent last week chopping between $29.18 and $31.37, closing $30.01 just under the weekly 13ema. This is a range chart with a real floor and a real ceiling, and neither side has it yet. Support is $29.65 – $28.99, then the $27.20 shelf. Resistance is $31.05 – $32.19, then $33.04 – $33.45. If $29.65 holds and price reclaims $31.05, look for $32.19, then the $33.04 – $33.45 rejections. Clear those in the coming months and $34.45 opens up, with the $37.97 shelf ultimately if the trend really plays out. If $29.65 gives way, watch $28.99, then $27.20 and $26.73. Earnings 11/23.
 Source: Pure Power Picks
PETROLEO BRASILEIRO
PBR is setting up as a potential bullish continuation play after forming a bull flag pattern and posting consecutive new 52-week highs from Oct 14th – 16th, signaling continued bullish momentum. Look for a sustained move and hold above the $26.00 flag / consolidation area, for upside targets at $26.50 – 27.44 – 28.56 – 28.91 – 29.80. If we see a sustained break and hold below the $25.00 – 24.70 area, look to possible downside targets at $24.25 – 23.56 – 22.45 – 20.60. Additional developments supporting the setup include the company receiving R$2.8 billion in fuel subsidies and an $859 million oil settlement from its oil-production partners.
 Source: TradingView
Pfizer
PFE is setting up as a potential bullish continuation play after breaking out of a double-top pattern on Oct 15th and reaching a new 52-week high. Another day of tight consolidation could help form a new bull flag pattern, setting the stage for the next potential move higher. Look for a sustained move and hold above the $29.50 – 30.00 area, for upside targets at $31.00 – 32.00 – 33.80 – 35.75 – 36.40 – 37.00 – 39.00. If we see a sustained break and hold below the $27.00 area, look to possible downside targets at $26.00 – 25.00 – 24.47 – 22.90 – 20.81 – 18.85. Earnings are scheduled for Nov 3rd before market open.
Source: TradingView Earnings Calendar
 Source: Earnings Whispers
Economic Calendar


