

Understanding Commodity Trading
Commodity trading is the buying and selling of raw materials like crude oil, natural gas, gold, copper, wheat, and corn, usually through futures contracts, options on futures, or exchange-traded funds that track them. These markets sit underneath the global economy. They help determine what you pay for gasoline, groceries, and heating your home. Prices move on supply and demand, weather, geopolitics, interest rates, and currency swings. That combination makes commodities fast-moving and often volatile. In this guide, we’ll cover what drives commodity prices, the main strategies traders use, how seasonal patterns work, how futures and options contracts are structured, and the mistakes that trip up new traders. By the end, you’ll have a working framework you can actually use.
Commodities are physical goods whose prices respond directly to real-world supply and demand. Traders typically access them through leveraged futures and options. Leverage magnifies every move in both directions, so risk management matters more than strategy selection. Learn the drivers of each market before you put capital behind an idea.
| Major categories | Energy (crude oil, natural gas, gasoline), metals (gold, silver, copper), agriculture (corn, wheat, soybeans, coffee), livestock |
| Main U.S. venues | CME Group exchanges (CME, CBOT, NYMEX, COMEX) and ICE |
| Common vehicles | Futures, options on futures, commodity ETFs, options on commodity ETFs, producer stocks |
| Key scheduled data | EIA weekly petroleum and natural gas storage reports, USDA WASDE monthly crop report, OPEC+ meetings |
| Primary risk | High leverage combined with sudden, news-driven price gaps |
What Is Commodity Trading and What Moves Prices?
Commodity trading means speculating on or hedging the price of raw materials. Prices are driven first by physical supply and demand, then by the economic and political forces that shape both.
There are two broad groups of participants. Hedgers, like farmers, airlines, and miners, use contracts to lock in prices and reduce business risk. Speculators, which includes most retail traders, take on that risk in pursuit of a price move. You need both groups for a healthy market.
This is where fundamental analysis earns its keep. Unlike a stock, a barrel of oil has no earnings report. Its value comes from three main pressures:
- Supply and demand: Track production levels, inventories, and consumption trends. Rising inventories usually signal weakening demand or excess supply.
- Economic indicators: GDP growth, employment, and inflation all shape demand for energy and industrial metals. Interest rates matter too, which is why it pays to understand how fed policy moves markets. Most commodities are priced in U.S. dollars, so a stronger dollar often weighs on prices.
- Geopolitics and trade policy: Conflicts in producing regions, sanctions, and trade disputes can disrupt supply overnight. Learning how tariffs affect prices is especially useful for metals and agricultural goods.
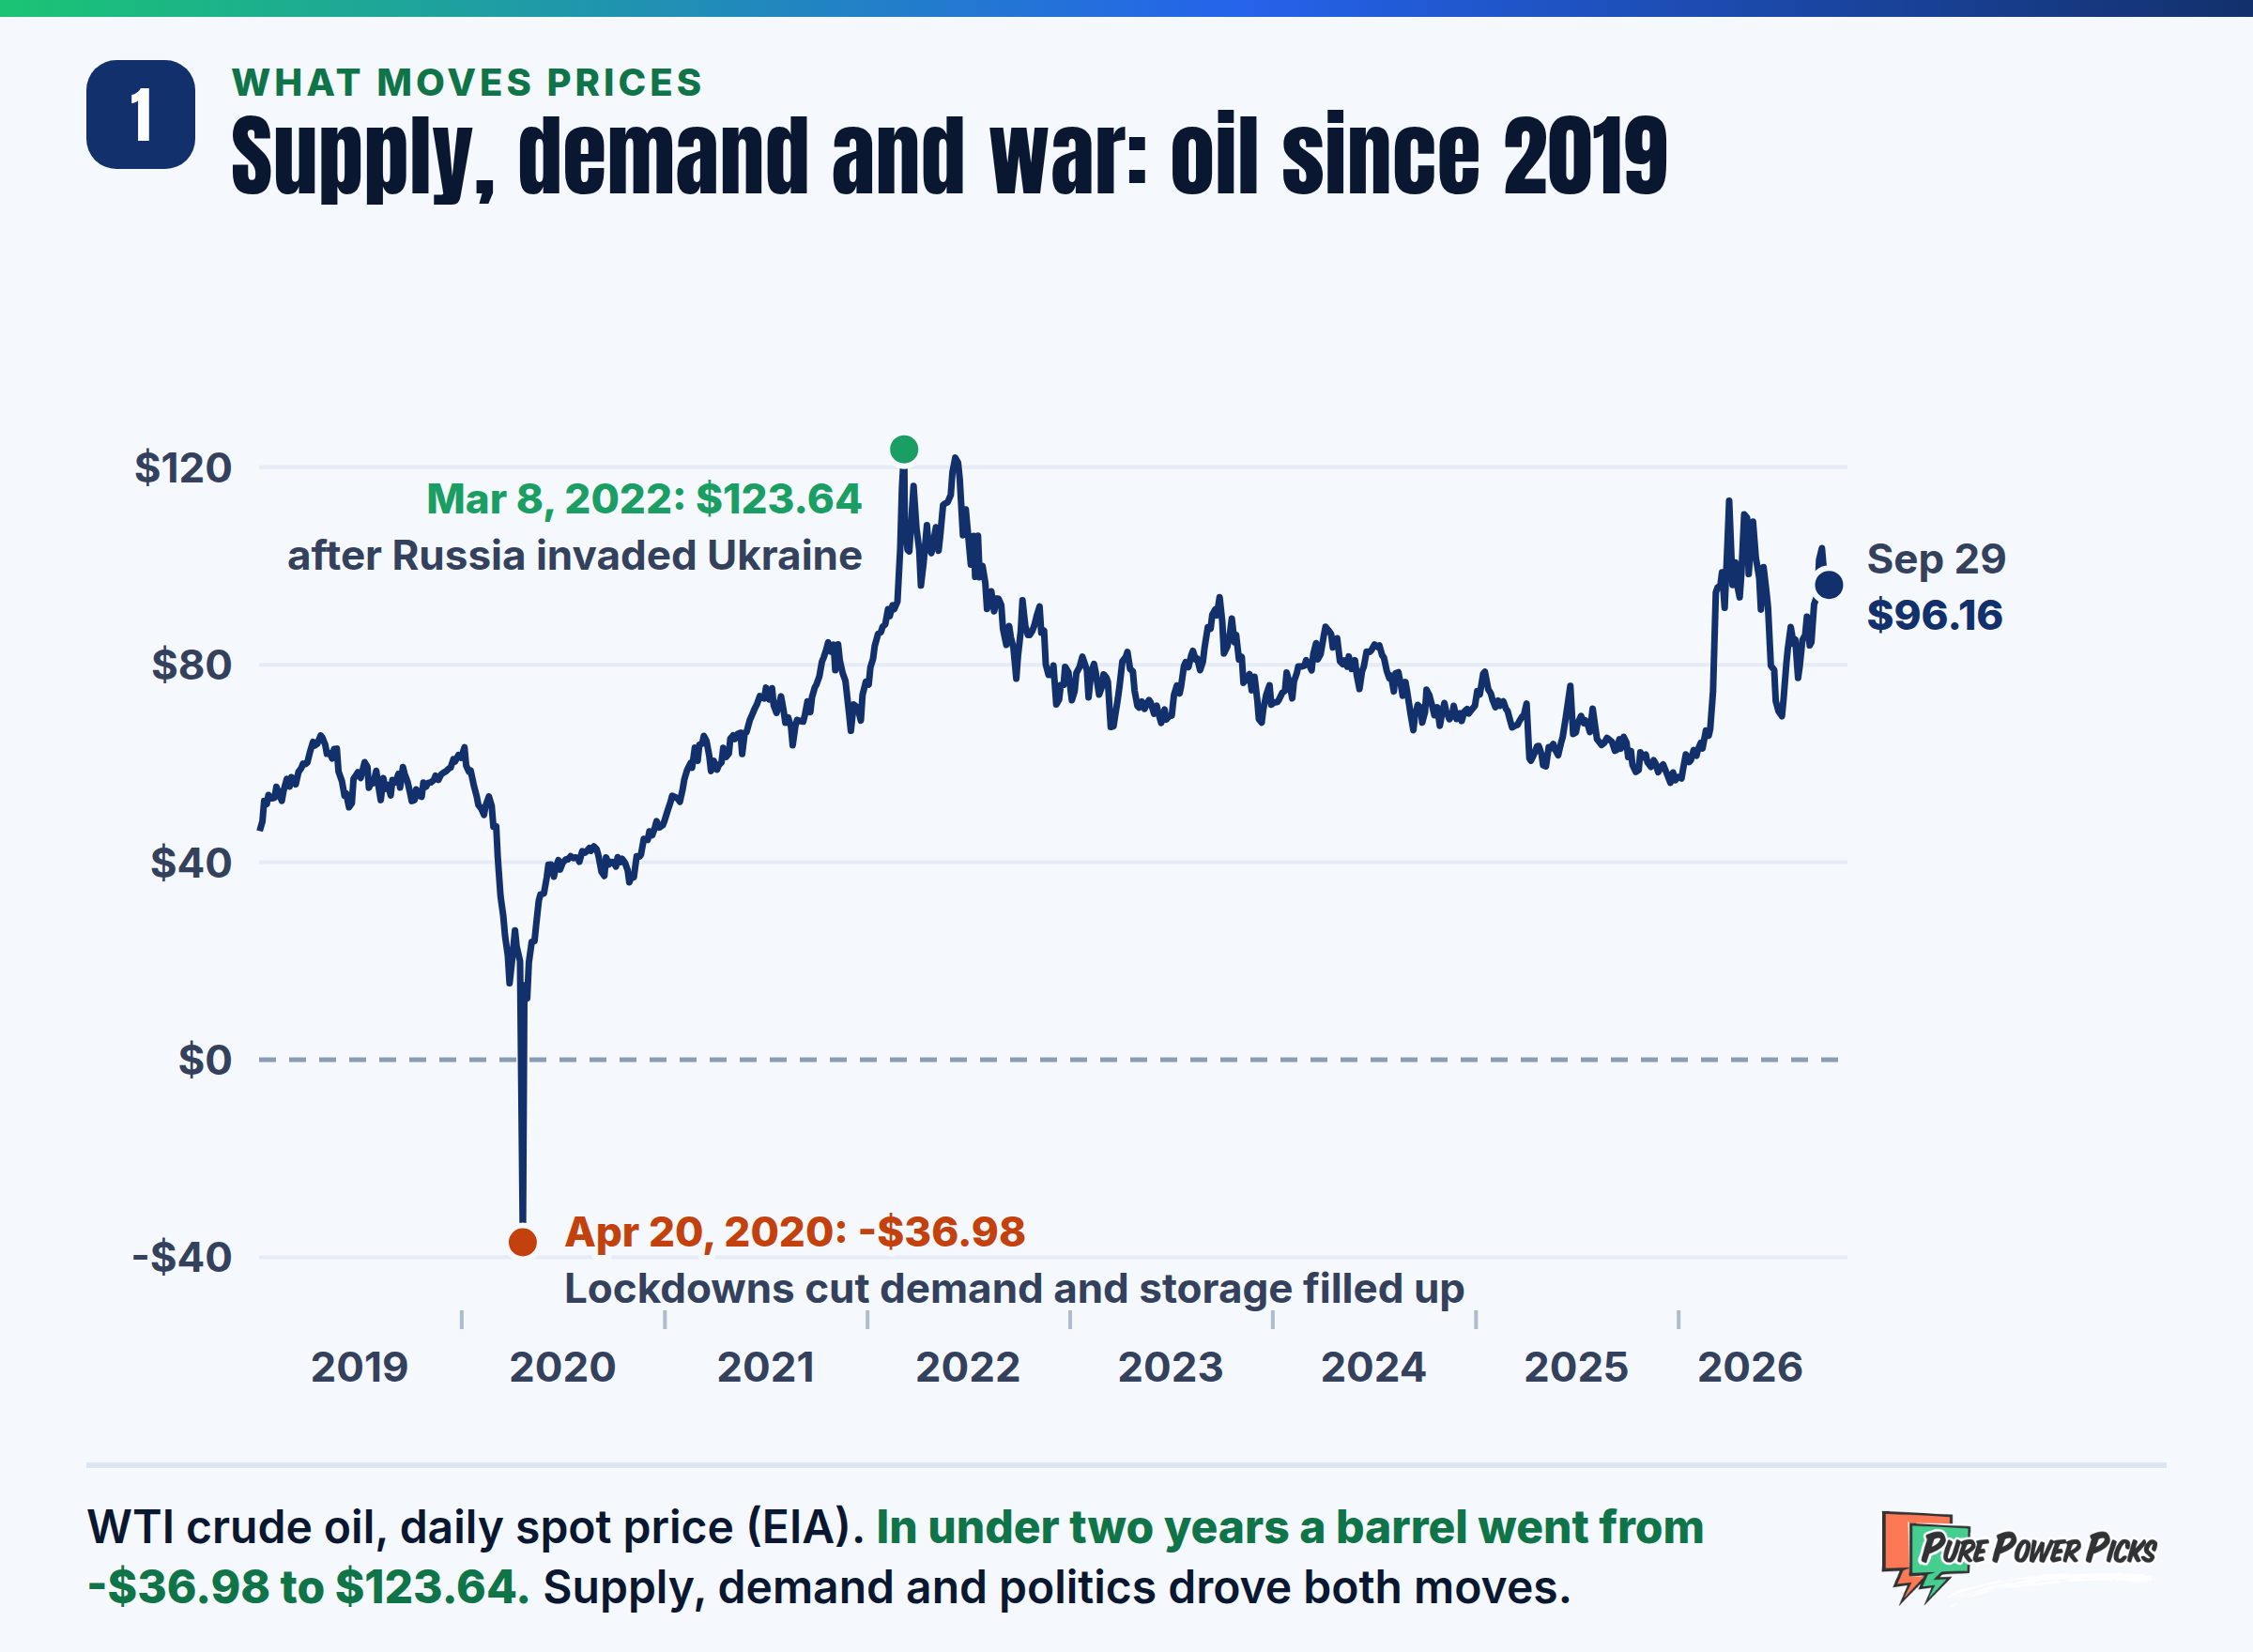
Oil shows all three at work. In April 2020, lockdowns cut demand so hard that storage filled up and a barrel of WTI briefly sold for -$36.98. Less than two years later, after Russia invaded Ukraine, the same barrel cost $123.64.
For a broader overview of how these markets are organized, Investopedia’s commodity market primer is a solid companion read.
What Trading Strategies Work for Commodities?
The most durable commodity strategies combine a fundamental view with technical timing. Fundamentals tell you why a market might move. Charts help you decide where your idea is right or wrong.
On the technical side, start with price structure: trends, support, resistance, and classic patterns like head and shoulders or double tops and bottoms. Then layer in indicators such as moving averages, RSI, MACD, and stochastics to spot potential turning points.
Volume adds context. A breakout on heavy volume carries more conviction than one on thin trading. Falling volume during a trend can warn that momentum is fading.
Most commodity approaches fall into two camps. Trend following means identifying a clear uptrend or downtrend and trading in that direction, often using moving averages to confirm direction. Range trading means buying near support and selling near resistance when a market moves sideways, with Bollinger Bands helping flag stretched conditions.
| Approach | Best Conditions | Key Tools | Main Risk |
|---|---|---|---|
| Trend Following | Strong supply shocks, sustained demand shifts | Moving averages, higher highs and lows | Whipsaws in choppy markets |
| Range Trading | Balanced supply and demand, quiet news flow | Support, resistance, Bollinger Bands, RSI | Sudden breakouts on news |
| Seasonal | Markets with recurring weather or crop cycles | Historical seasonal charts, weather forecasts | Patterns can fail in any given year |
How Do Seasonal and Weather Patterns Affect Commodity Prices?
Many commodities follow recurring calendar patterns because production and consumption follow the seasons. Weather is the wild card that can strengthen, weaken, or break those patterns.
Natural gas demand tends to climb ahead of winter heating season. Gasoline demand typically rises during the summer driving season. Grain markets often react to planting conditions in spring and to harvest supply in the fall.
Weather events can override all of it. A drought can shrink a crop, a cold snap can drain gas storage, and Atlantic hurricane season (June through November) can threaten Gulf Coast energy infrastructure.
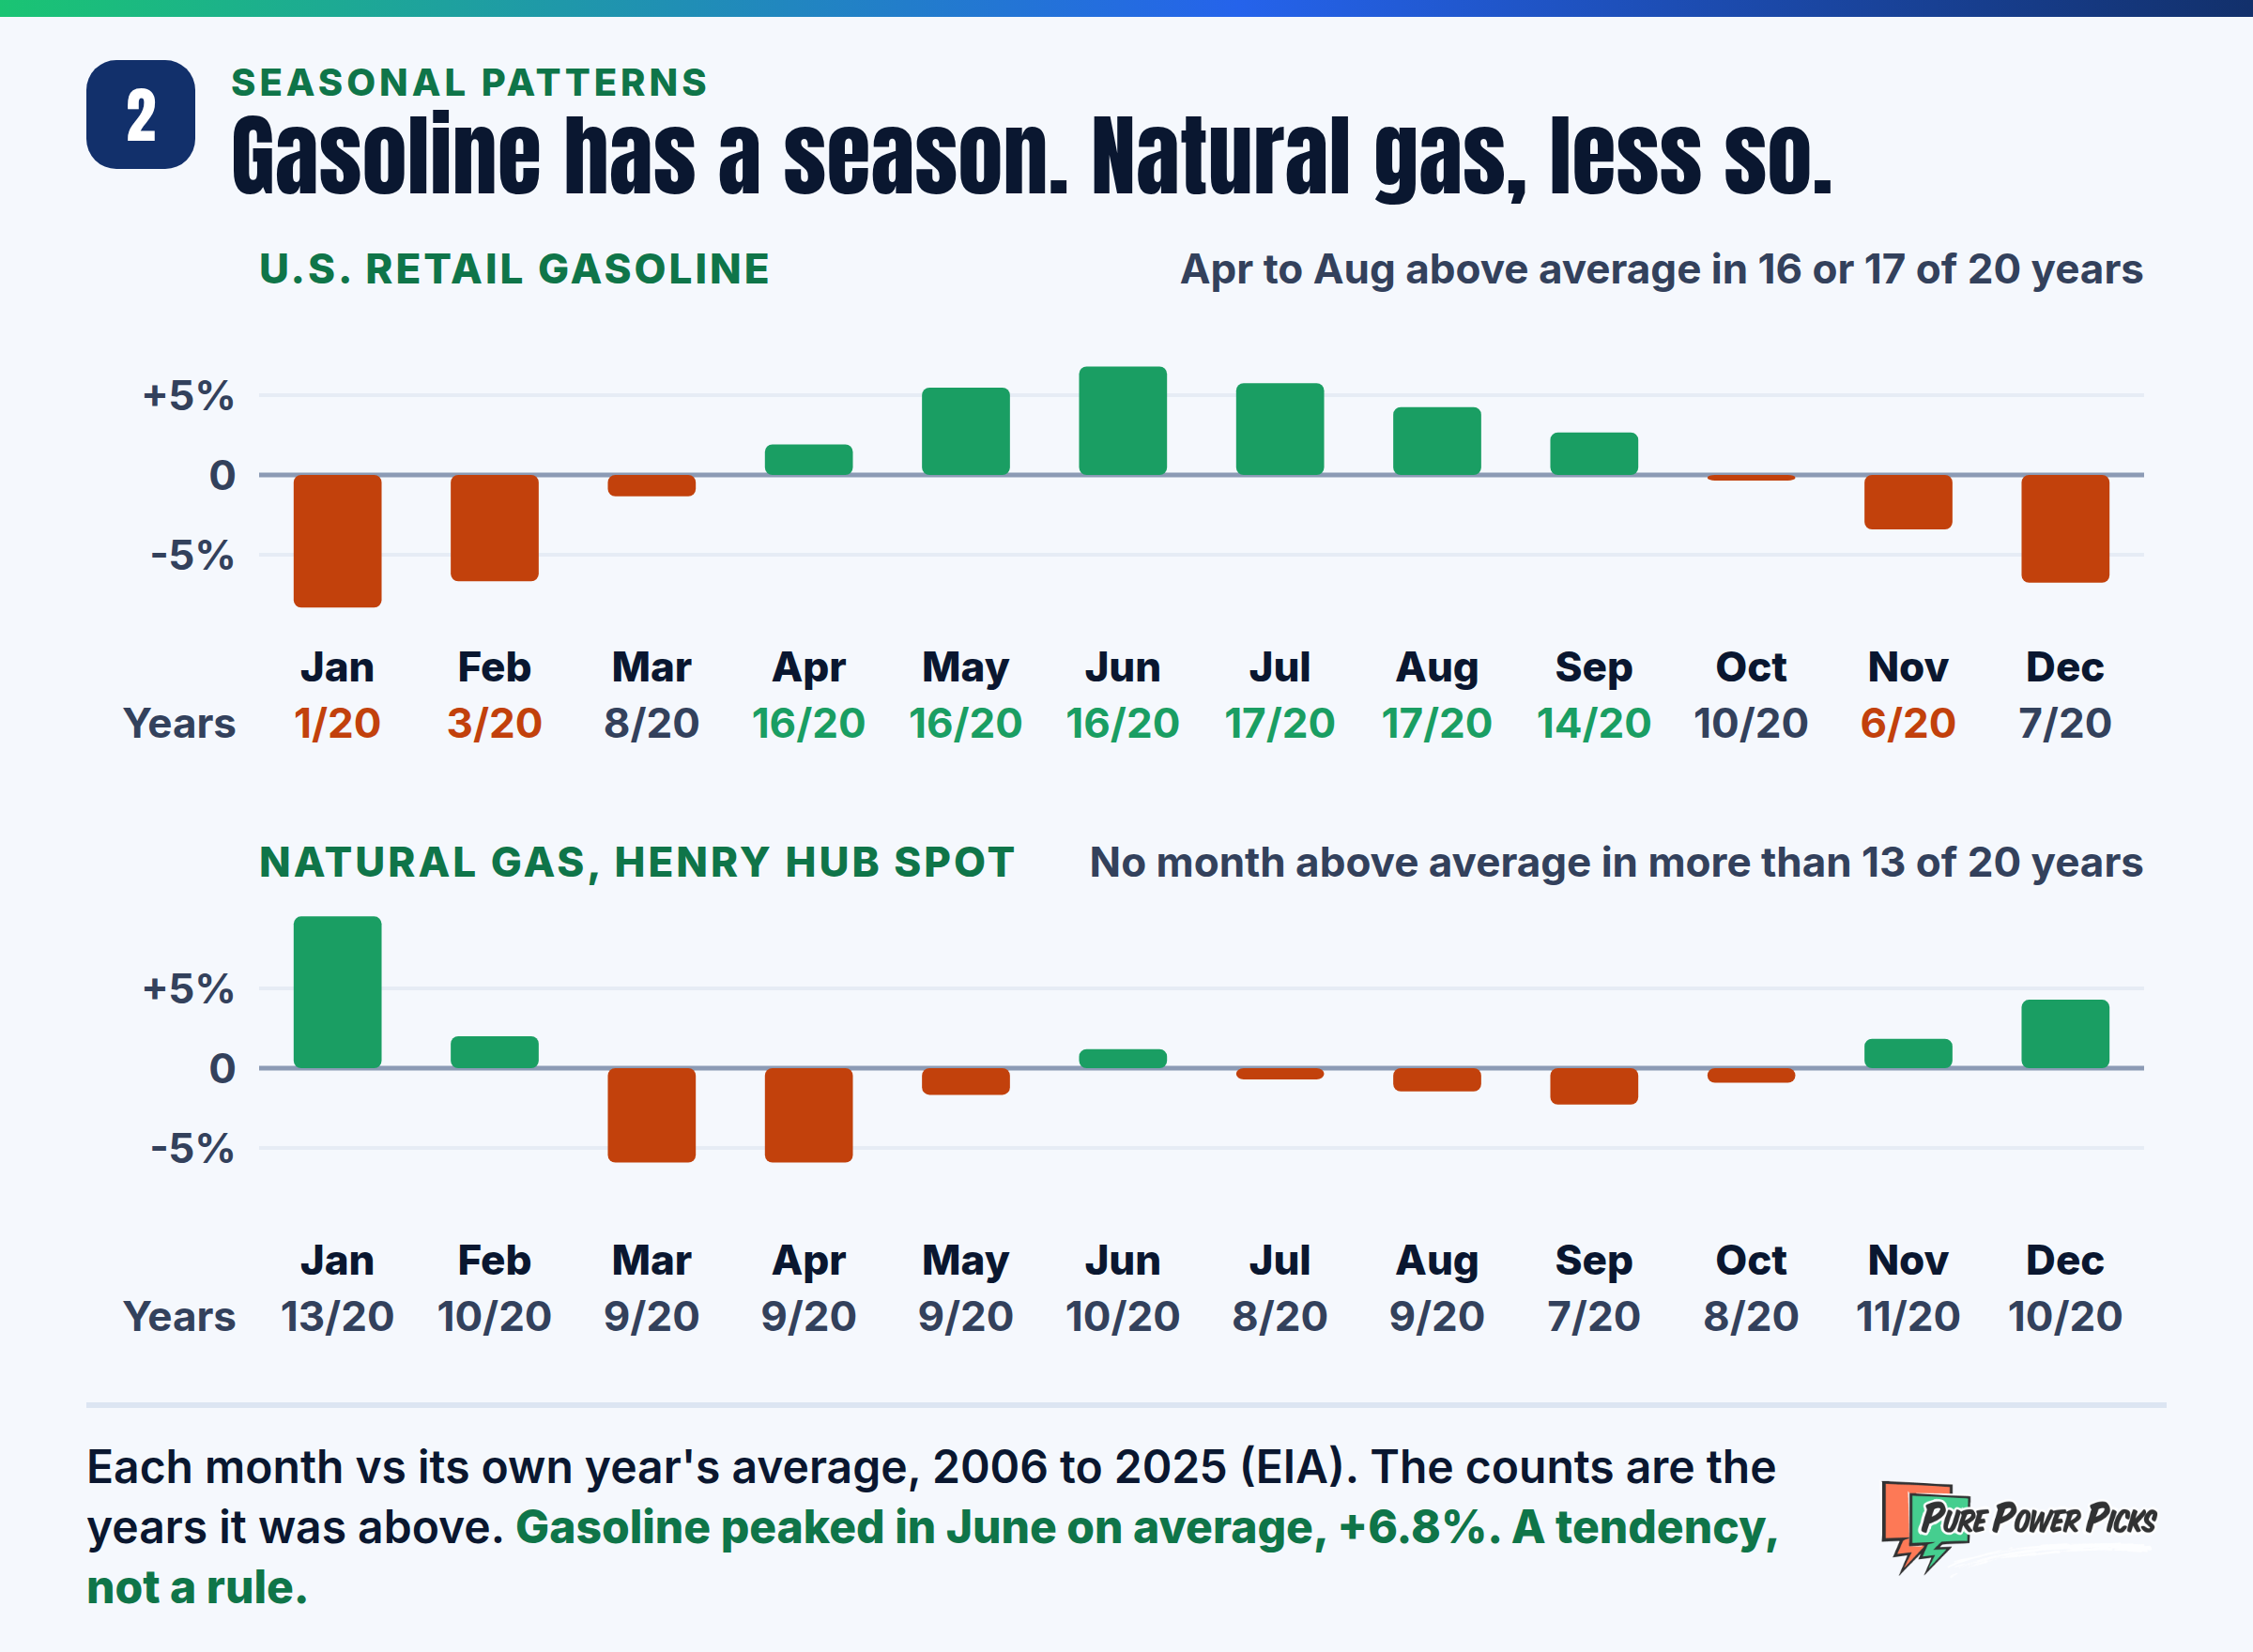
Twenty years of prices show the difference. U.S. gasoline sat above its yearly average from April to August in 16 or 17 of 20 years. Natural gas spot prices had no month that was above average in more than 13 of 20 years.
Scheduled news matters just as much. OPEC+ production decisions, the weekly EIA inventory reports, and the USDA’s monthly WASDE crop estimates regularly cause sharp moves. Mark these dates on your calendar before you place any trade.
Energy in particular reacts violently to headlines. If you want to see how traders think through that, our guides on energy market volatility and short-dated oil price swings go deeper.
Treat seasonality as a tailwind, not a trigger. A seasonal tendency tells you which direction has historically been favored. You still need price action to confirm the idea before you commit capital to it.
How Do Futures and Options on Commodities Work?
A futures contract is a standardized agreement to buy or sell a set quantity of a commodity at a set price on a future date. An option gives you the right, but not the obligation, to buy or sell that contract or an ETF at a set strike price.
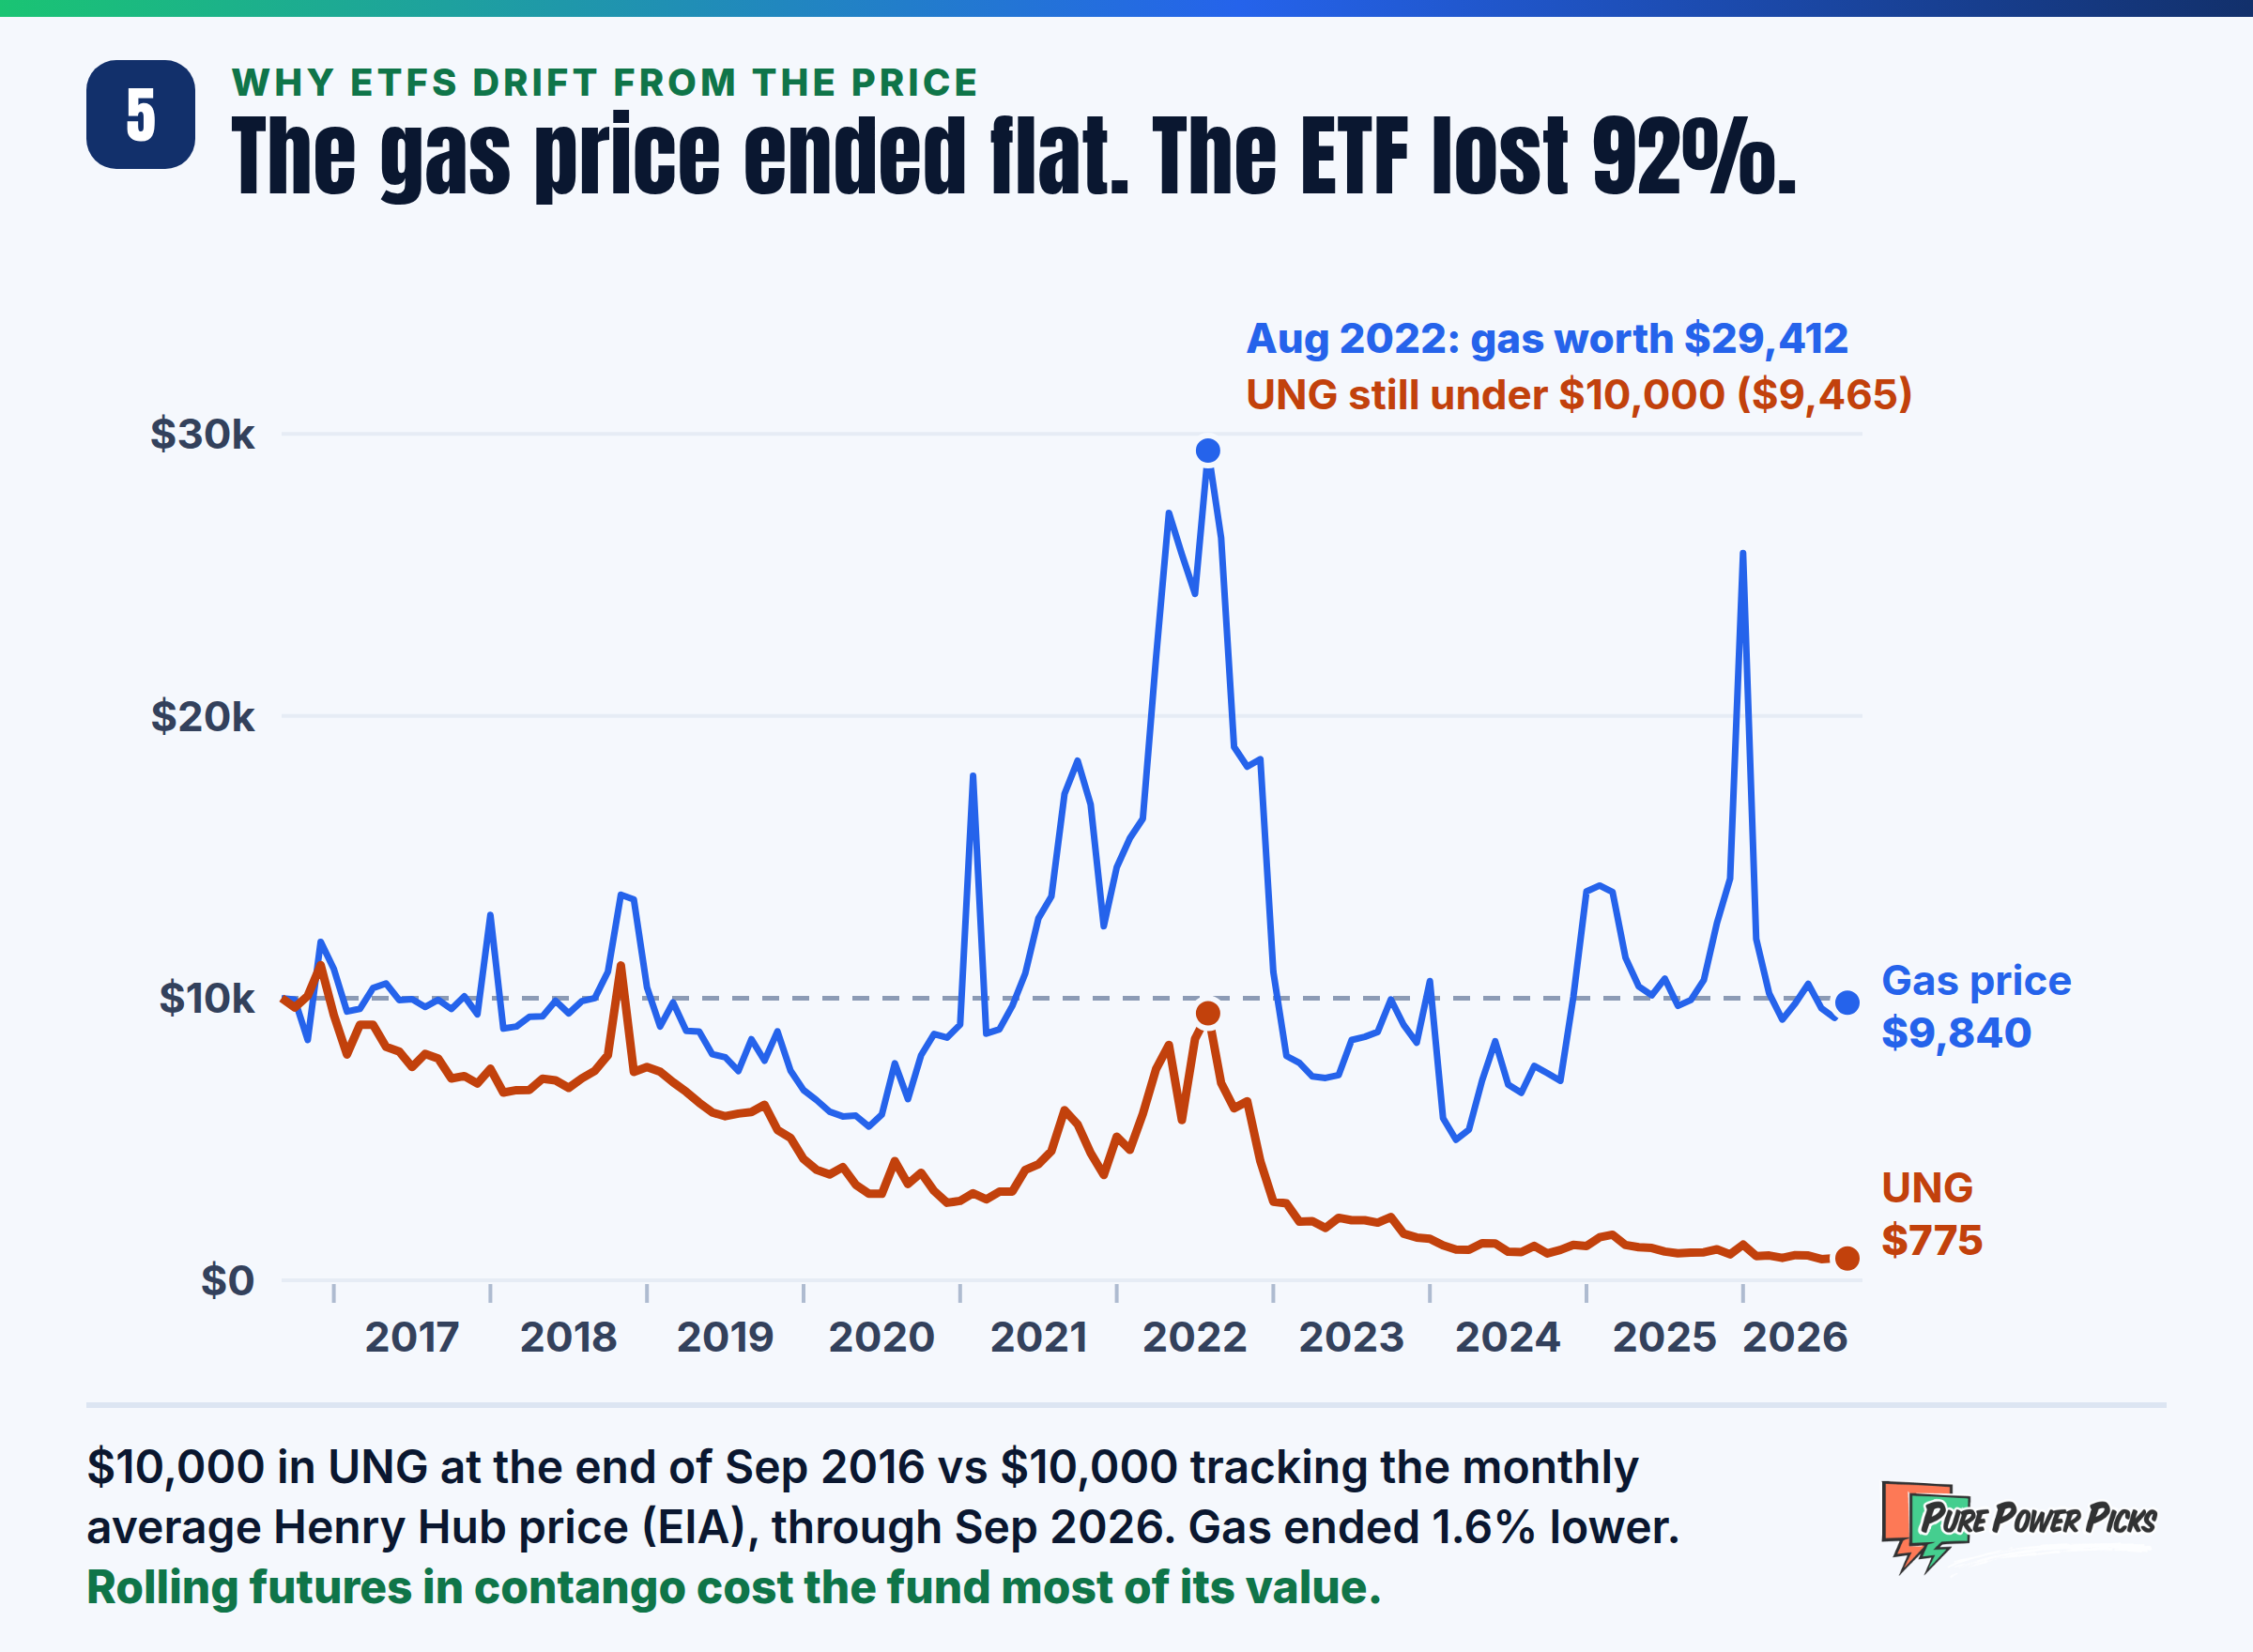
Contango is when later-dated futures trade above near-dated ones. Backwardation is the opposite. These curve shapes affect commodity ETFs that “roll” from one contract month to the next, which is why an ETF can drift away from the spot price over time.
Contracts are standardized by the exchange. A standard NYMEX crude oil contract represents 1,000 barrels. A COMEX gold contract covers 100 troy ounces. A CBOT corn contract is 5,000 bushels. That standardization is what makes these markets liquid.

It also creates serious leverage. You only post a fraction of the contract’s value as margin. If you’re new to that concept, read up on how leverage works in trading before going further. The Investopedia guide to futures contracts also covers the mechanics well.
Here’s a hypothetical example. Say crude oil trades at a hypothetical $70 per barrel. One contract controls $70,000 worth of oil. Every $1 move changes the contract’s value by $1,000. A $5 drop, which can happen in a single volatile week, swings the account by $5,000.
Options can define that risk. In the same hypothetical scenario, a trader who expects higher prices might buy a call option on an oil ETF for a $200 premium. The most that trader can lose is the $200 paid. If oil never rallies, the option can expire worthless, so defined risk is not the same as low risk.
Many retail traders skip futures and use options on commodity ETFs through a regular brokerage account. Spreads are another way to shape risk, as we cover in our guide to trading oil volatility with spreads. The Cboe Options Institute is another free resource for options basics.
How Do You Manage Risk When Trading Commodities?
You manage commodity risk by deciding your maximum loss before you place the trade, sizing the trade to fit that loss, and spreading exposure across uncorrelated markets. Strategy is secondary. Survival comes first.
- Stop-loss orders: Pick the price where your idea is clearly wrong and plan to close the trade there. Remember that stops can fill worse than expected when markets gap.
- Trade sizing: Many traders risk only 1% to 2% of their account on any single idea. Calculate size based on the distance to your stop, not on how confident you feel.
- Diversification: Don’t stack all your capital in one commodity. Crude oil and natural gas, for example, often move for different reasons.
- Account type: Know whether you’re trading with borrowed funds. Our breakdown of margin versus cash accounts explains the tradeoffs.
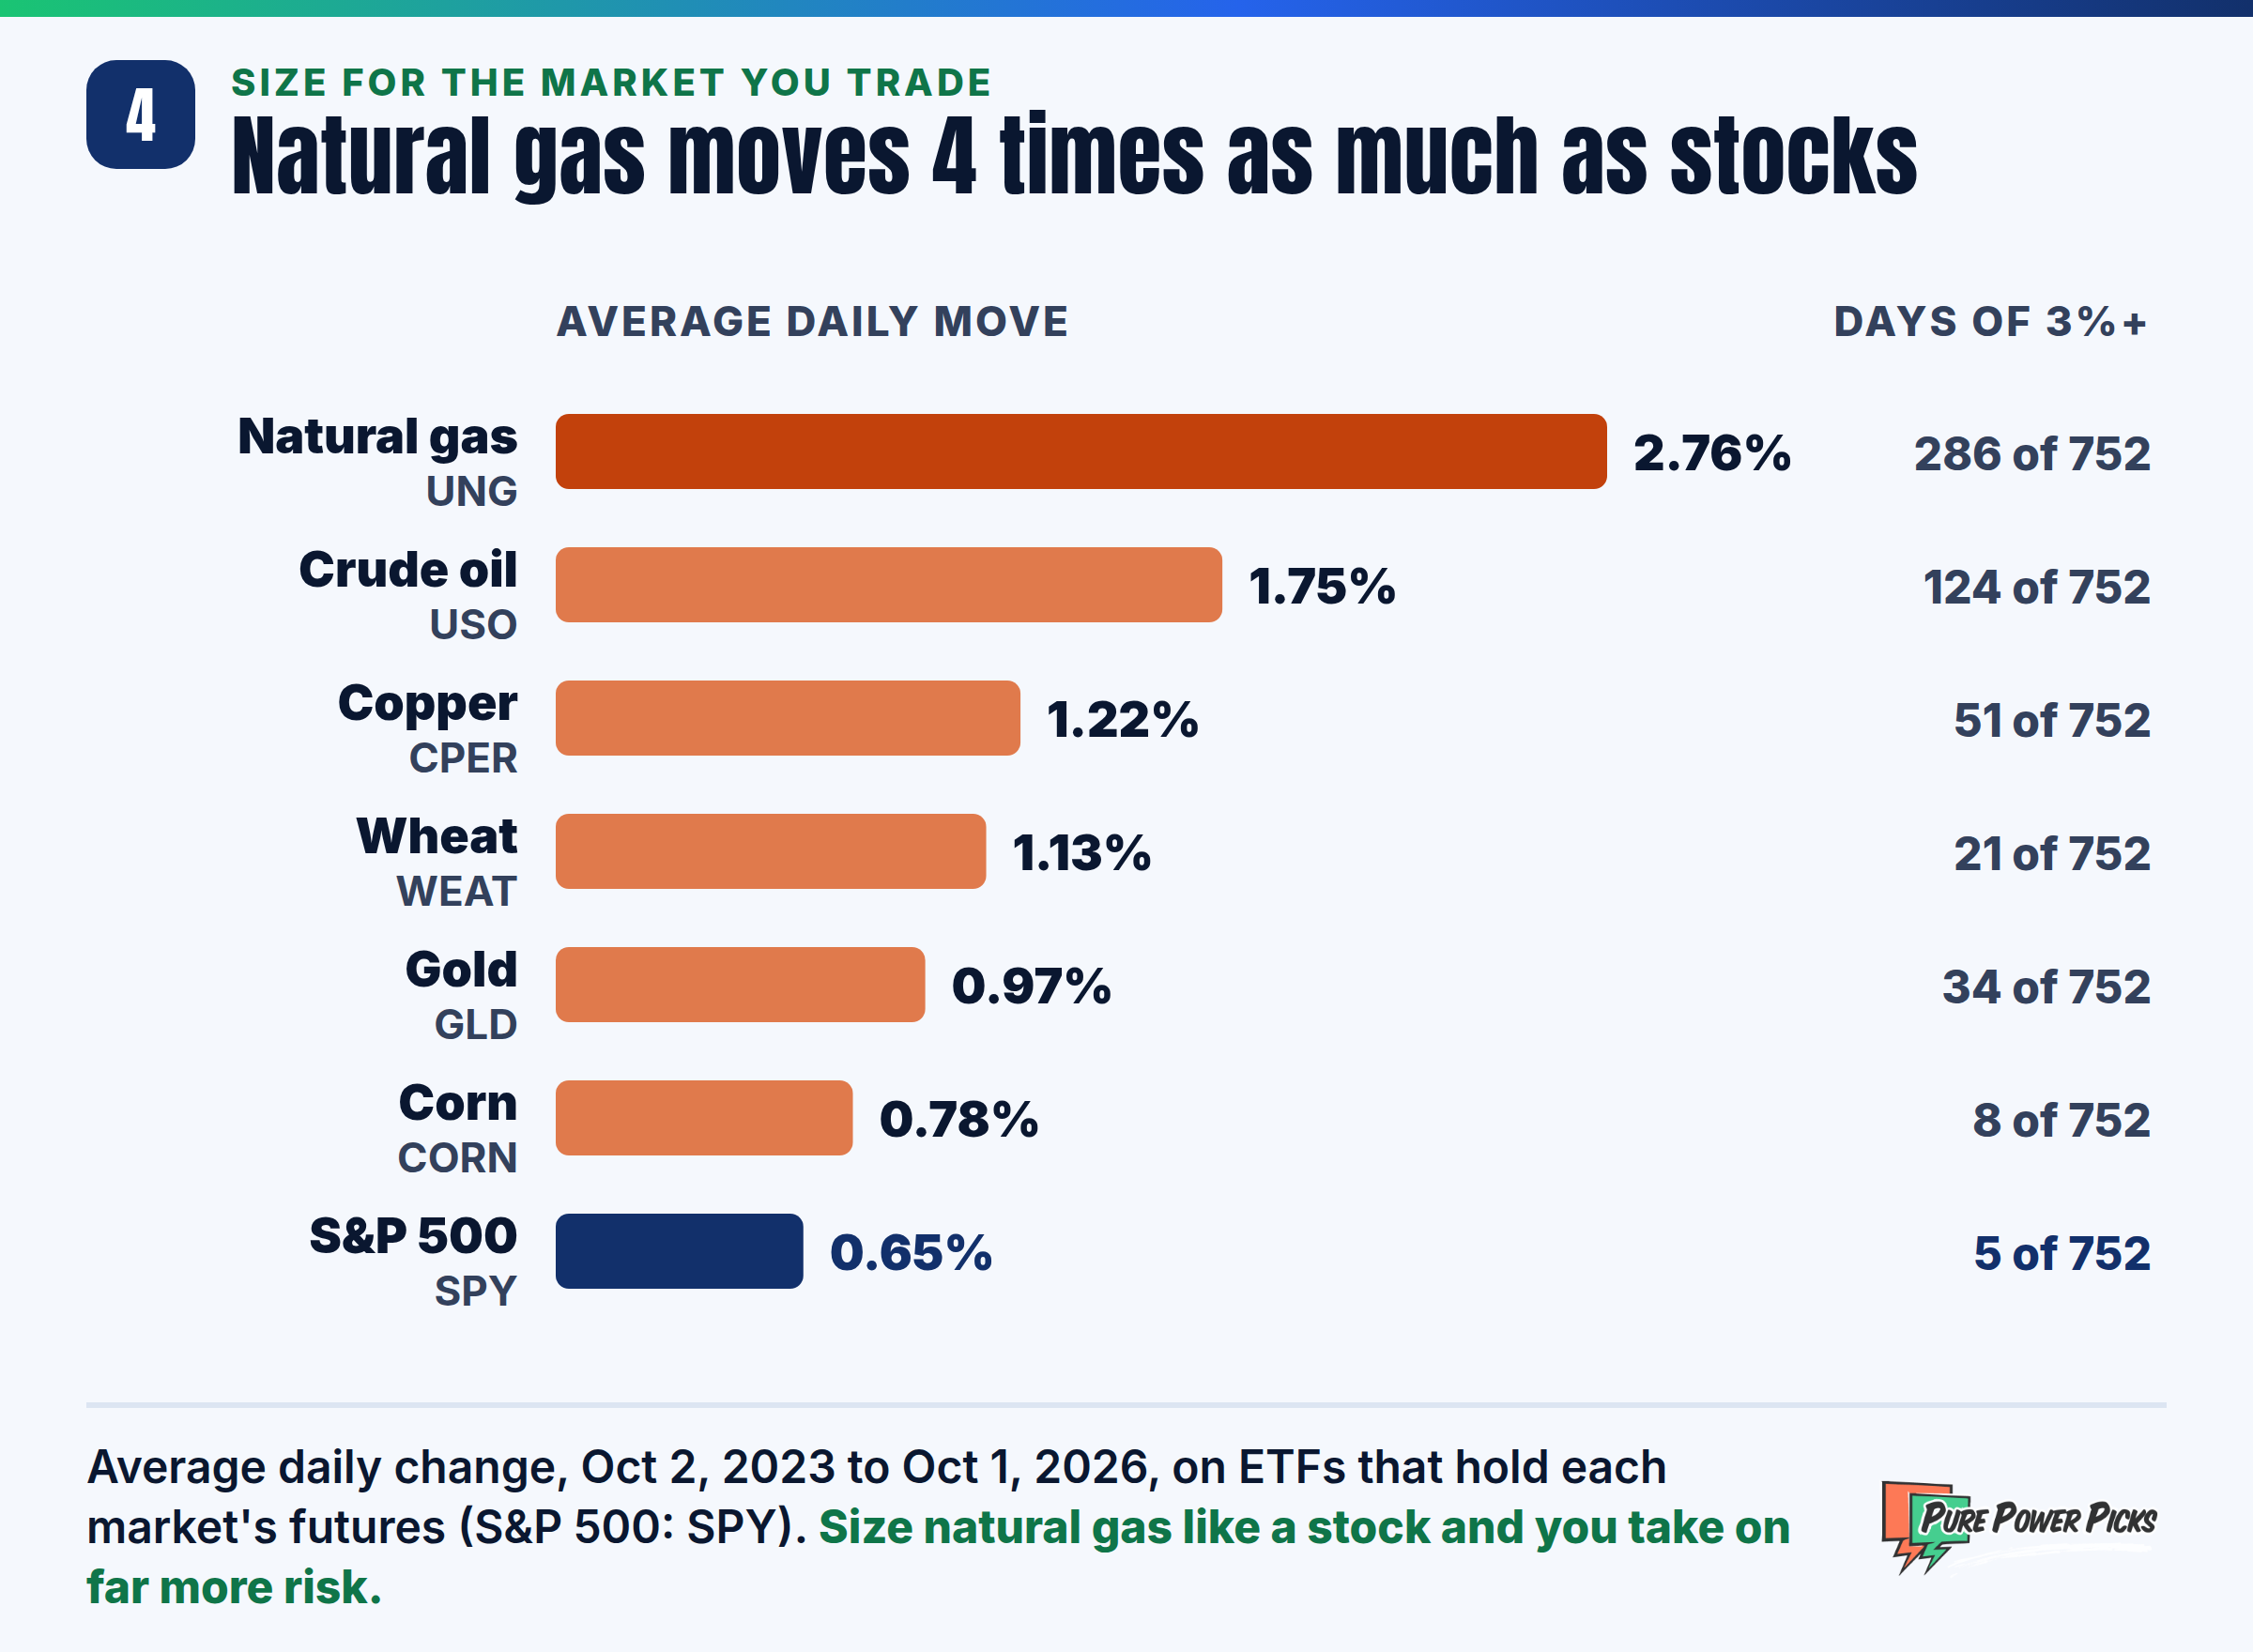
Size each trade to the market you are in. Over the last three years natural gas moved 2.76% on an average day, more than four times the S&P 500’s 0.65%, and it moved 3% or more on 286 of 752 trading days.
Before risking real money, practice with paper trading. It lets you test your process through a few report days and see how fast these markets move. For a full framework, see our guide to managing your trading risk.
With futures, losses can exceed the money in your account. Margin requirements can also rise suddenly during volatile periods, forcing you to add funds or close trades at bad prices. Never trade futures with money you cannot afford to lose.
What Are the Most Common Mistakes in Commodity Trading?
The biggest mistakes are over-leveraging, ignoring scheduled reports, and trading a market without understanding what drives it. Nearly every blown-up commodity account traces back to one of these.
- Too much size: Leverage turns a normal move into an account-threatening one.
- Ignoring the calendar: Holding through an EIA or WASDE release without a plan is a gamble.
- Forgetting expiration: Futures expire and options decay. Know your dates.
A few more to watch. New traders often buy commodity ETFs as long-term holdings without realizing contango can erode their value over time. Others chase headlines after a big move has already happened, buying right at the top of an emotional spike.
UNG, an ETF that holds natural gas futures, shows how big that cost can get. From September 2016 to September 2026 the average natural gas price ended 1.6% lower, while $10,000 in UNG shrank to $775.
Each commodity also has its own quirks: storage costs, delivery rules, contract months, and trading hours. Gold reacts to real interest rates and the dollar. Corn reacts to weather in the Midwest. Learn the specific personality of a market before you trade it, and keep refining your essential trading terms as you go.
Finally, skipping continuous learning is a mistake in itself. Commodity markets evolve with technology, policy, and global demand. The traders who last are the ones who keep adapting their process.
Frequently Asked Questions
Can beginners trade commodities?
Yes, but start small and simple. Many beginners begin with commodity ETFs or defined-risk options on those ETFs rather than futures, because the maximum loss is easier to control. Paper trade first to learn how these markets behave around major reports.
What is the difference between commodity futures and commodity ETFs?
Futures are direct, leveraged contracts on a commodity with set expiration dates. ETFs trade like stocks and often hold futures internally, rolling them each month. That roll process means an ETF may not track the spot price perfectly over long periods.
Which commodities are the most actively traded?
Crude oil, natural gas, gold, corn, and soybeans are among the most liquid commodity markets. High liquidity generally means tighter bid-ask spreads and easier order fills, which matters a lot for options traders.
Can commodities help diversify a stock portfolio?
They can, because commodities sometimes move differently from stocks, especially during inflationary periods. That relationship isn’t guaranteed, though. If protection is your goal, also look at dedicated approaches to hedging a portfolio, and review how the stock market works to understand how the two connect.
How much money do you need to start trading commodities?
It depends on the vehicle. Full-size futures require margin deposits that can run into the thousands per contract, while micro futures and ETF options require far less. Whatever you start with, only use risk capital you can afford to lose entirely.
Want to See How Traders Read Energy and Commodity Setups?
Pure Power Picks shares educational options chart setups and ideas, with the reasoning behind each one, so you can build your own analysis skills. Every alert is a learning tool, not a recommendation.
Explore Trade Alert Plans
The PPP Team is the research and editorial team behind Pure Power Picks. We trade stocks and options and publish the work as we do it, with every alert tracked in public. Publishing since 2020. How we research and correct our work is written out in our editorial standards. Our content is strictly educational, never advice.
Disclaimer: The content provided by Pure Power Picks is for educational and informational purposes only and does not constitute financial, investment, or trading advice. We are not registered financial advisors. All examples in this article are hypothetical and are not real trades or alerts. Trading commodities, futures, and options involves substantial risk, including the potential loss of more than your initial investment, and is not suitable for all investors. Past market behavior, including seasonal patterns, does not guarantee future results. Always do your own research and consult a licensed financial professional before making any investment decisions.