

StockCharts Review (2026): Is It Worth It for Options Traders?
Share


Verdict: StockCharts is an excellent choice for traditional technical analysts and equity investors who prize clean charting and top-tier education, but it falls short for dedicated options traders who need chains, Greeks, and strategy modeling.
StockCharts is a polished, education-rich charting platform built for traditional technical analysts and equity investors, not dedicated options traders. If you live and breathe clean charts, sector rotation, and world-class free learning, it delivers. If you need option chains, Greeks, and strategy modeling, you will need to pair it with a broker or a purpose-built options tool.
Is StockCharts good for options trading? Honestly, not on its own. This stockcharts review cuts straight to it: StockCharts is one of the cleanest, most reliable web-based charting platforms available, and its ChartSchool education is arguably the best free technical analysis library on the internet. But it was built for chartists and equity investors, not for options traders. There is no option chain, no Greeks, no strategy builder, and no profit-and-loss modeling. What you do get is a fast, dependable charting engine, a strong scan engine, and sector rotation tools that help you read the broader market. For an options trader, that makes StockCharts a solid analysis companion rather than a command center. You will still need a broker to place trades and, ideally, a dedicated options tool for chains and Greeks. Read on for the full breakdown.
StockCharts platform walkthrough.
StockCharts Pricing: What Do the Tiers Actually Get You?
StockCharts keeps pricing simple with three membership tiers. Entry pricing is genuinely affordable, and the progression is logical as you move up.
The Basic and Extra tiers are strong value for chart-focused analysts. The Pro tier, at nearly $50 a month, feels steep when you compare it to modern all-in-one platforms that bundle real-time data with actual trading and options tools. That trade-off matters a lot for options traders. For a wider look at the market, see our best charting software compared guide.
- ChartSchool is one of the most comprehensive free technical analysis education resources available anywhere
- Clean, reliable SharpCharts engine with a low learning curve makes it approachable for traditional technical analysts
- Strong scanning engine and sector rotation tools support systematic market analysis
- Affordable entry pricing at $19.95/month with a well-structured tier progression
- ACP platform modernizes the charting experience while retaining the trusted classic engine
- Options functionality is minimal, with no options chain, Greeks, strategy builder, or P&L modeling, limited to IV and put/call ratio charts
- Not an execution platform, so traders must use a separate broker to actually place options trades
- Feature depth lags behind modern all-in-one platforms for advanced or active options traders
- Mobile experience offers limited feature parity compared to the full desktop web platform
- Higher Pro tier pricing feels steep given the lack of trading and options-specific capabilities
How Good Is StockCharts’s Options Chain?
Short answer: there isn’t one. StockCharts does not offer an options chain, and this is the single biggest limitation for options traders. You cannot pull up strikes, expirations, bid/ask spreads, or open interest inside the platform.
What StockCharts does offer on the options side is analytical, not transactional. You get implied volatility charts, put/call ratio charts, and a handful of options-related indicators. These are genuinely useful for reading market sentiment and gauging whether fear or greed is driving the tape. Watching a put/call ratio spike or tracking IV trends can inform your directional bias before you go elsewhere to structure the actual trade.
But that is where it stops. When it comes time to select a strike, size the position, or evaluate a spread, you are leaving StockCharts entirely. That workflow gap is exactly why we score options features a 3 out of 10.
The put/call ratio measures the volume of put options traded against call options. A high reading often signals bearish sentiment or hedging; a low reading suggests bullish positioning. It is a sentiment gauge, not a timing tool, so use it as context rather than a trigger. Learn more from Investopedia.
Can You Build Multi-Leg Strategies on StockCharts?
No. StockCharts has no strategy builder and no profit-and-loss modeling. If you want to visualize a vertical spread, iron condor, or calendar, this is not the platform for it.
This is worth stating plainly because it separates charting platforms from true options platforms. Tools like a strategy builder let you model max risk, breakeven points, and payoff diagrams before you commit capital. That kind of visualization is central to disciplined options trading, and StockCharts simply does not attempt it.
Where StockCharts still earns its keep for options traders is the analysis that comes before the strategy. Clean price charts, well-drawn support and resistance, and reliable indicators help you define your directional thesis and your key levels. If you want to sharpen that skill set, our guide on support and resistance levels pairs well with what SharpCharts does best. The point is that StockCharts handles the “where and why” of a chart, while your broker or a dedicated options tool handles the “how” of the structure.
Use StockCharts for what it is best at: identifying the setup and the key levels. Then take those levels to your broker’s platform to build and price the actual options strategy. Treat StockCharts as your analysis layer, not your execution layer, and the workflow makes sense. Pair it with our thinking on strategic chart analysis.
How Does the ACP Charting Experience Hold Up?
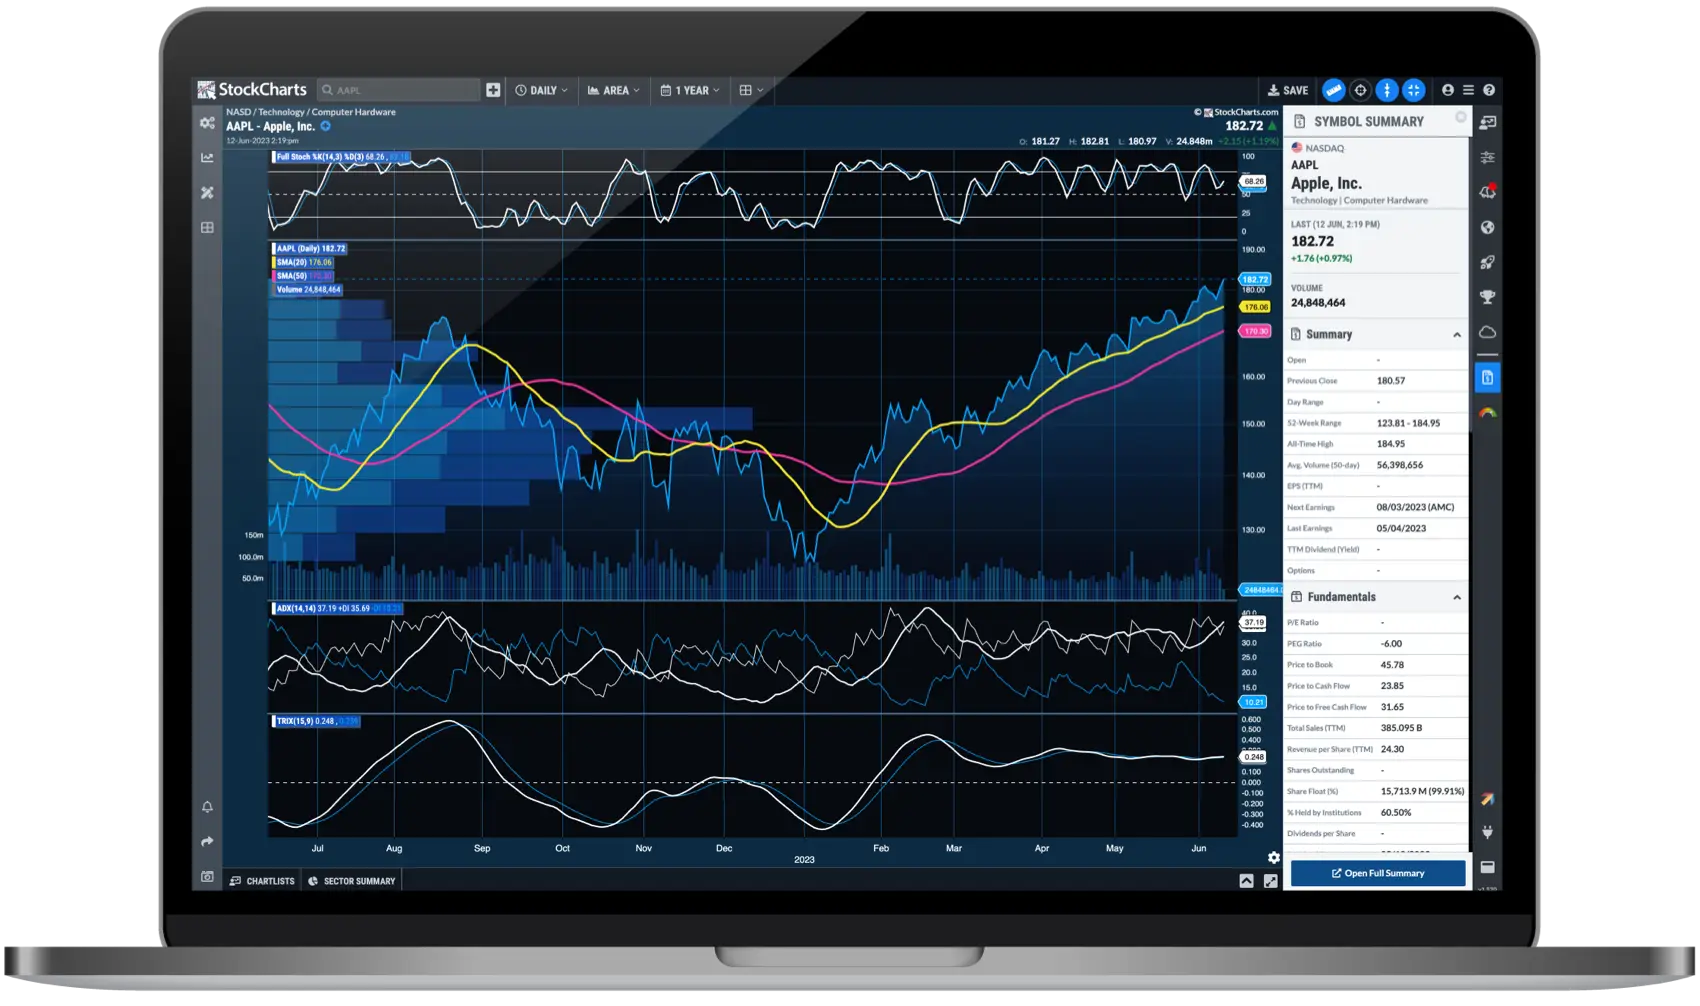
This is where StockCharts shines. The Advanced Charting Platform, or ACP, modernizes the charting interface while preserving the trusted classic SharpCharts engine underneath. If you have ever run a StockCharts ACP review side by side with the legacy experience, you will notice the layout is faster, more flexible, and more pleasant to work in without abandoning what long-time users trust.
The charts are clean, reliable, and quick to load. Drawing tools are straightforward, indicators apply cleanly, and the learning curve is genuinely low. That approachability is a big part of why we score ease of use an 8 out of 10. A beginner can open a chart and be productive within minutes, which is not something every platform can claim.
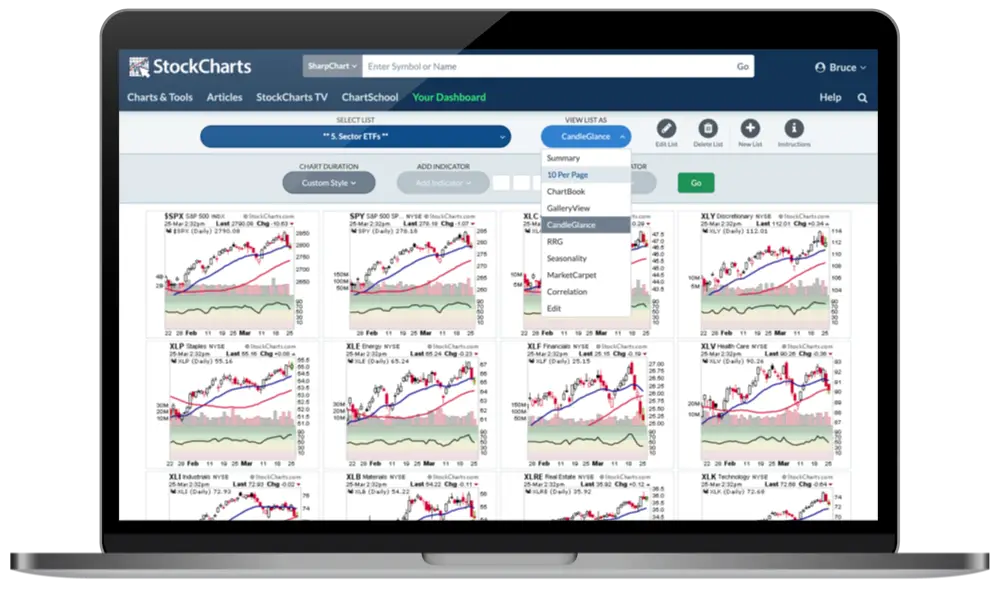
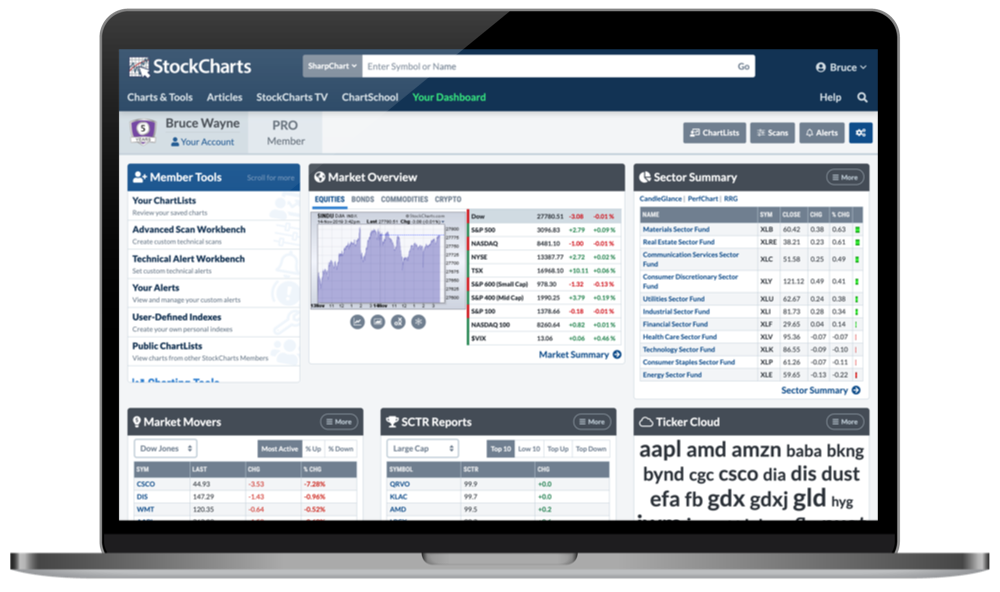
The scan engine deserves a mention too. It is a real strength for systematic analysts who want to filter the market by technical criteria and surface candidates worth studying. Combined with the sector rotation tools and market summary dashboards, StockCharts gives you a solid framework for top-down analysis. If finding candidates is your bottleneck, our walkthrough on finding stocks to trade complements the scan engine nicely. The main knock is that mobile does not carry the full desktop feature set, which caps the score at 6 out of 10 for on-the-go work.
Is StockCharts Worth It for the Education Alone?
For many traders, yes. ChartSchool is one of the deepest free technical analysis libraries anywhere, covering chart patterns, indicators, market indicators, and trading systems in clear, organized detail. It is the kind of resource you can return to for years.
If you are still building your foundation, that education carries real weight. Understanding why charts work before you risk capital is non-negotiable, and our own piece on why charting matters reinforces the same principle. StockCharts earns an 8 out of 10 on education for good reason, and for a self-directed learner, that alone can justify a Basic membership. Just remember: education about charts is not education about options structure, so you will still need to fill that gap elsewhere.
Who Is StockCharts Best For?
- Traditional technical analysts who want a clean, reliable charting engine and precise drawing tools without bloat.
- Equity swing traders and position traders who make decisions off daily and weekly charts rather than fast options flow.
- Self-directed learners who value ChartSchool and want to build a genuine technical analysis foundation for free or cheap.
- Top-down analysts who use sector rotation, market breadth, and scanning to frame the broader market before drilling into names.
Skip this if… you are a dedicated options trader who needs an option chain, live Greeks, a strategy builder, and P&L modeling in one place. StockCharts was not built for that workflow, and forcing it will only frustrate you. In that case, an all-in-one platform or a broker with strong options tools is the better home base.
How Does StockCharts Compare?
The comparison tells the story cleanly. In a stockcharts vs tradingview matchup, StockCharts wins on education and simplicity, while TradingView pulls ahead on mobile, community, and flexibility. Dig deeper in our tradingview review and our tc2000 review if options tooling is your priority.
How Do Other Reviewers Rate StockCharts?
Our 3.5/5 is an options trader’s score. Step back to the whole platform, though, and the broader trading community rates StockCharts highly across independent review sites:
PPP scores StockCharts narrowly, on options-specific value: the tools options traders actually use day to day. These third-party scores rate the whole platform across all types of traders, which is a different lens, and both reads are useful. Ratings shown as of July 2026 and reflect each site’s full user base, not options traders alone.
Frequently Asked Questions
Is StockCharts worth it for options traders?
For pure options trading, StockCharts is not the ideal primary tool. It has no options chain, Greeks, strategy builder, or P&L modeling, offering only implied volatility and put/call ratio charts. It works well as an analysis companion for reading charts and sentiment, but you will need a broker or a dedicated options platform to actually structure and price trades.
Does StockCharts have an options chain?
No. StockCharts does not provide an options chain, so you cannot view strikes, expirations, bid/ask spreads, or open interest inside the platform. Its options-related features are limited to implied volatility charts, put/call ratio charts, and a few sentiment indicators. To access a full options chain, you will need to use your brokerage platform or a dedicated options tool.
How much does StockCharts cost?
StockCharts offers three tiers: Basic at $19.95 per month, Extra at $29.95 per month, and Pro at $49.95 per month. Basic includes ACP charting and predefined scans, Extra adds custom scans and intraday data, and Pro adds real-time data and priority alerts. Pricing may change, so verify current details on the official StockCharts website.
Is StockCharts or TradingView better?
It depends on your priorities. StockCharts is better for clean, simple charting and unmatched free education through ChartSchool. TradingView is better for mobile use, community features, custom scripting, and broader flexibility. Neither is a full options trading platform, but TradingView generally offers more modern all-in-one functionality for active traders.
Can I cancel StockCharts anytime?
Yes. StockCharts memberships are subscription-based and can be canceled through your account settings, with no long-term contract required. Because terms and refund policies can change, always confirm the current cancellation and billing details directly on the StockCharts website before subscribing.
What is ChartSchool on StockCharts?
ChartSchool is StockCharts’s free technical analysis education library. It covers chart patterns, technical indicators, market breadth indicators, and complete trading systems in a clear, well-organized format. It is one of the most comprehensive free resources of its kind and is a major reason many traders subscribe to StockCharts even without full options functionality.
StockCharts earns a solid 3.5/5 as a clean, education-first charting platform for traditional technical analysts and equity investors. Dedicated options traders will love the charts but should pair it with a broker or an options-focused tool for chains, Greeks, and strategy modeling.
Our trade plans break down every setup with key levels, risk zones, and the reasoning behind each trade idea, so you can build the skills to analyze markets yourself.
Read more trading guides and reviews on our blog.
Disclaimer: Pure Power Picks is not a licensed financial advisor. All content is for educational and informational purposes only and should not be considered investment advice. Options trading involves substantial risk of loss and is not suitable for all investors. Past performance does not guarantee future results. Platform features and pricing may change, verify current details on the official website.
Related Reviews
More platforms we’ve reviewed for options traders:
- TrendSpider Review →AI-powered technical analysis platform with automated trendlines,…
- TC2000 Review →Fast desktop charting platform with integrated brokerage, EasyScan…
- Webull Review →Commission-free trading platform with clean interface, paper…
- Black Box Stocks Review →Real-time stock and options alert system with proprietary…
Share

The PPP Team is the research and editorial team behind Pure Power Picks. We trade stocks and options and publish the work as we do it, with every alert tracked in public. Publishing since 2020. How we research and correct our work is written out in our editorial standards. Our content is strictly educational, never advice.