

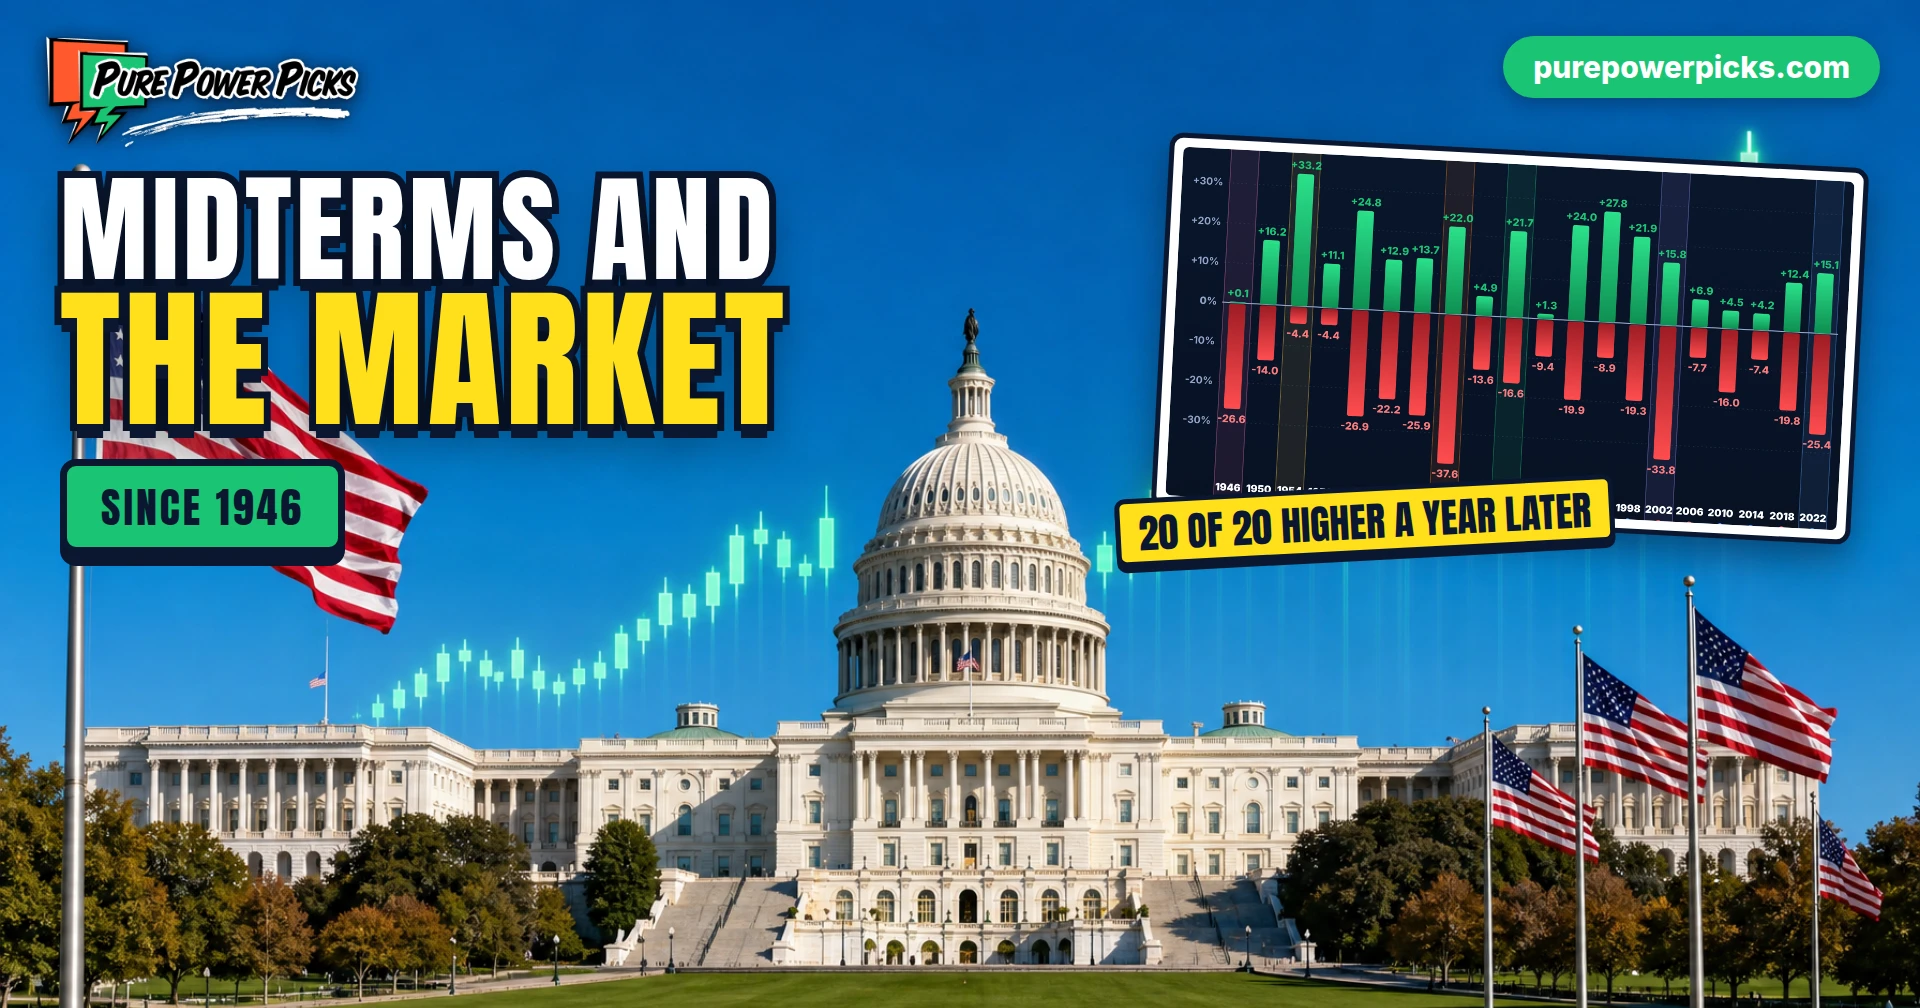
Midterm Elections and the Stock Market: How Stocks Have Done Since 1946
Share


Every two years, between presidential races, Americans vote in the midterm elections: all 435 House seats, about a third of the Senate and most governors. The next one is Tuesday, November 3, 2026. Midterms have a reputation on Wall Street, and the data backs it up in two directions. The months before a midterm have been some of the roughest stretches of the four year presidential cycle, and the twelve months after have been some of the best. This guide walks through how the S&P 500 has behaved around all 20 midterm elections since 1946, why the pattern exists, whether it matters which party wins, and how 2026 compares so far.
Since 1946 the S&P 500 has been higher one year after every one of the 20 midterm elections, by +14.7% on average. The midterm year itself is a different story: the index fell 18.0% from a high to a low inside the average midterm year, and it ended the year up just 3.8% on average. The pattern is real, but it is a record of 20 elections, not a promise about the next one.

What Are Midterm Elections?
Midterm elections fall halfway through a president’s four year term. Voters choose every member of the House of Representatives, who serve two year terms, and roughly a third of the Senate, whose members serve six. Most states also elect governors and legislators in the same year. The president is not on the ballot, but the result decides whether the president’s party keeps control of Congress, and with it the ability to pass the budget, tax and spending bills that move markets.
Midterms usually go against the party in the White House. Since 1946 the president’s party has lost House seats in 18 of 20 midterms; the only gains came in 1998 under Bill Clinton and 2002 under George W. Bush. The House historian keeps the official results for every election back to 1920.
The idea that stock returns follow the four year rhythm of a presidential term: year one after the inauguration, year two with the midterm, year three before the next presidential race and year four with the race itself. It was popularized by Yale Hirsch in the Stock Trader’s Almanac. It describes averages, not a law of the market.
How the Stock Market Does in Midterm Years
Group every calendar year since 1949 by where it falls in the term, and the midterm year stands out for the wrong reason. The S&P 500 averaged +4.6% in midterm years, against +8.5% in year one, +17.2% in year three and +8.1% in election years. The median tells it more clearly still: a typical midterm year returned +1.1%, the year after it +18.9%.

The midterm year was also the least reliable. The index finished higher in 11 of 19 midterm years, against 17 of 19 pre election years. Some of the worst calendar years of the postwar era were midterm years: -29.7% in 1974, -23.4% in 2002 and -19.4% in 2022.
The Midterm Year Pattern: Flat Until Fall
Averaging the daily path of every midterm year from 1950 to 2022 shows where the weakness sits. The typical midterm year drifted sideways into spring, slid to a low of about 2.2% below where it started by early summer, and was barely positive on Election Day. Then it rallied, finishing the year +4.6%, about half the +9.6% of an average year.
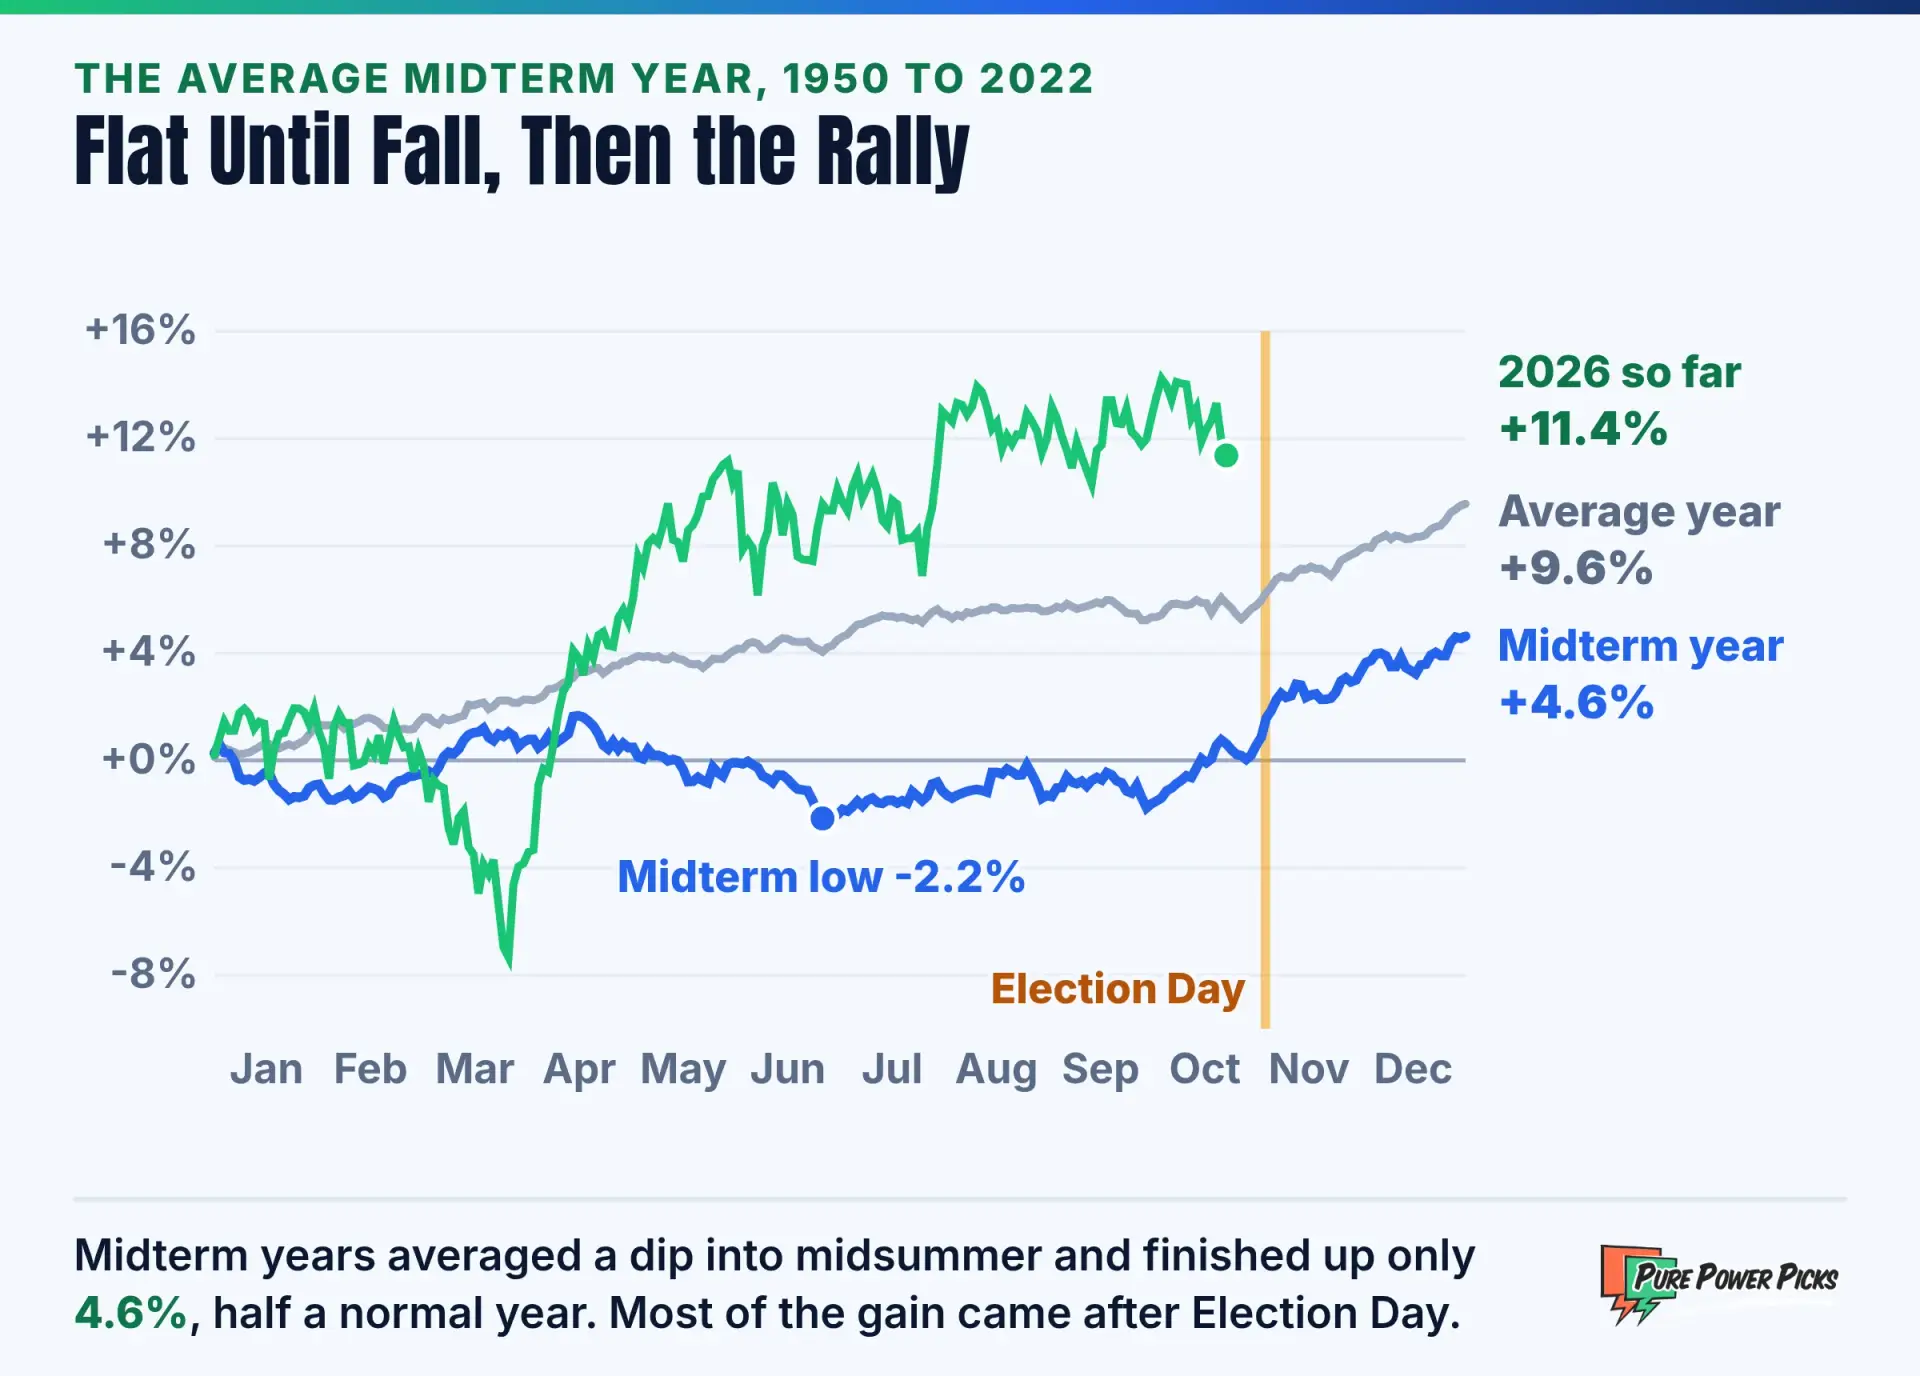
The averages hide how rough individual years got. Inside the average midterm year the index fell 18.0% from a high to a low, and 12 of the 20 midterm years saw a drop of 15% or more at some point. Only 2, 1954 and 1958, got through with less than 5%.
Why Stocks Struggle Before a Midterm
No single cause explains it, but three forces show up again and again.
- Uncertainty about Congress. Markets price what they can forecast. A midterm puts control of the House and Senate in play, and with it the outlook for taxes, spending, regulation and the debt ceiling. Until the votes are counted, that is a risk investors demand to be paid for.
- Policy fatigue in year two. A new president usually spends the first year passing the big agenda items. By the midterm year, the stimulus from those bills is in the past and the fights over the next ones are ahead.
- The calendar did some of the work. Several of the deepest midterm year drops lined up with shocks that had nothing to do with the election: Watergate and an oil embargo in 1974, the dot com bust in 2002, the Federal Reserve’s fastest rate hikes in four decades in 2022. With only 20 midterms, a few bad years move the average a lot.
The midterm effect is strongest as a description of risk, not direction. If your plan already assumes a 15% to 20% pullback is possible in a given year, a midterm year is when that assumption has historically been tested most often.
When the Midterm Year Hit Bottom
The month of each midterm year’s lowest close splits the history neatly. 5 midterm years made their low in January and climbed from there. The painful years were different: 6 of them bottomed in October, weeks before the vote (1946, 1966, 1974, 1990, 2002, 2022), and every one of those was down at least 20% at its low.
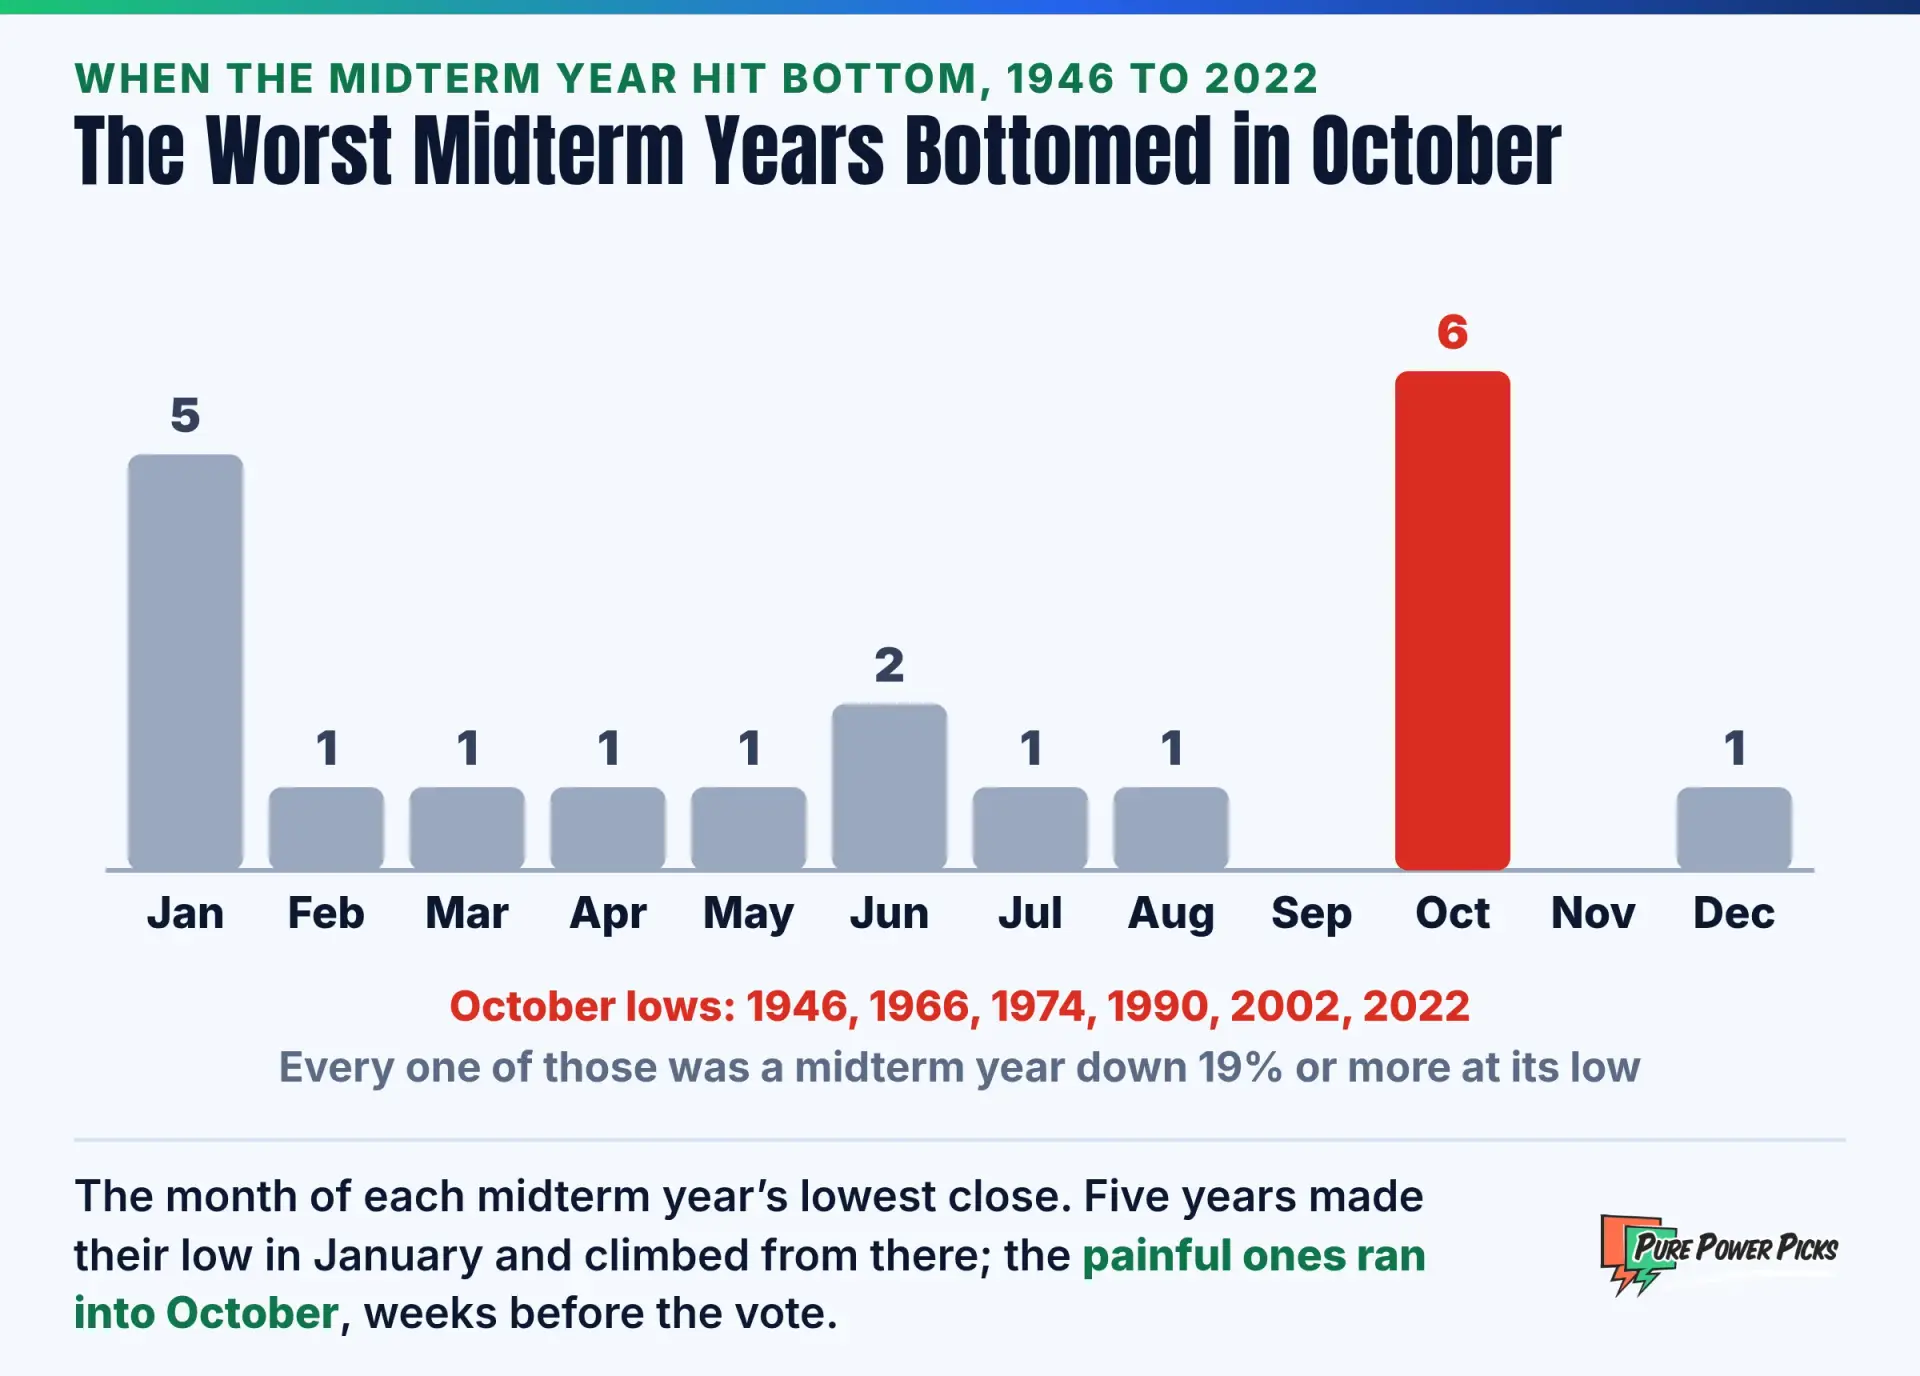
That is the setup behind the famous low to high stat. From each midterm year’s lowest close, the S&P 500 rose an average of +34.4% to its highest close within the following twelve months, and never less than +14.3%. In 1982 the August 12 low started one of the great bull markets, and the index gained +66.9% inside a year.
Nobody knows the low while it is happening. The low to high figure measures from the exact bottom, which is a number only hindsight can give you. A trader buying “the midterm dip” in 2022 would have bought in June, again in September, and watched the index make a new low on Oct 12.
What Happens to Stocks After the Midterm Election
Measured from the close before each Election Day, the S&P 500 was higher three months later in 18 of 20 midterms, six months later in 19 and twelve months later in all 20. The average gains were +7.6%, +13.2% and +14.7%. For comparison, the same twelve month window starting in early November of every year since 1950 averaged +9.5%, and was positive 57 times out of 75.

The streak deserves an honest footnote. In 1946 the index was up +0.1% a year later, which is higher only by a hair. And the gains were often a rebound from a bad year rather than a new leg up: the three biggest midterm year drops, 1974, 2002 and 1962, were followed by gains of +22.0%, +15.8% and +24.8%.
Every midterm since 1946
S&P 500 daily closes, price only. Year return is the calendar year. Deepest drop is the largest high to low decline inside the calendar year. One year after is from the close before Election Day. “Unified” means the president’s party held the House and Senate after the vote.
Does It Matter Which Party Wins?
Less than most people expect. After the 15 midterms that left a divided government, the S&P 500 averaged +14.6% over the next year. After the 5 that left one party in charge of the White House and both chambers, it averaged +14.9%. By the president’s party the gap is wider, +16.2% under Republican presidents and +13.2% under Democrats, but ten elections a side is far too few to call that a rule.
The more useful reading is that the end of uncertainty mattered more than the winner. Once the votes are in, investors know who writes the next two years of legislation, and gridlock, the most common result, tends to mean fewer surprises. That fits the pattern of a weak run into Election Day and a stronger run after it.
If you follow how politicians themselves trade, our free live trackers show disclosed trades by members of Congress, including the Nancy Pelosi stock tracker.
How 2026 Compares So Far
This midterm year has not followed the script. Through Oct 23, 2026 the S&P 500 was +11.4% for the year, far ahead of the +0.6% the average midterm year showed by late October. Its deepest drop was 9.1%, from the Jan 27 close to the Mar 30 close, which is milder than 15 of the last 20 midterm years.
Two readings of that are possible, and history supports both. A strong year into the vote has happened before: 1954, 1958 and 1998 were all up double digits by Election Day and still rose over the following year. But a market that has already climbed has less of a midterm discount to recover, and a calendar pattern carries no information about earnings, interest rates or valuations, which drive prices far more than any election does.
The midterm pattern says the year after the vote has been strong, and it has been strongest when the year before it was weak. 2026 has been a strong year, so the history is a reason for confidence, not a reason to expect another 2022 style rebound.
How Options Traders Can Use the Midterm Cycle
For options traders the election calendar matters through volatility as much as direction. Implied volatility tends to rise into an event the market cannot price and ease once it is over. Around the nine midterms since 1990, the VIX closed at an average of 21.9 the day before Election Day and 20.8 a week later, and it fell in 6 of the 9. That is a tendency, not an edge you can lean on: in 2018 the VIX was the same a week later and rose through December.
- Size for the drawdown, not the average. A midterm year has averaged a 18.0% high to low drop. Defined risk positions such as credit spreads or debit spreads cap what a pullback can cost.
- Know what the volatility is pricing. Our guide to implied volatility walks through how event premium builds and drains, the same mechanics that show up around elections and FOMC meetings.
- Hedge with a date in mind. If a long stock portfolio is the worry, a put spread that runs past Election Day costs less than an open ended hedge. Our guide to hedging a portfolio with options covers the setup.
- Give the post election thesis time. The midterm gains came over months, not days: three months after the vote the index was higher in 18 of 20 cases, twelve months after in all of them. A short dated call bets on timing the history never promised.
The Limits of the Midterm Pattern
Twenty data points make a striking chart and a thin statistic. A few more cautions before treating the pattern as a trading signal:
- Coincidence is doing real work. Several of the best post election years were recoveries from recessions or bear markets that would likely have recovered anyway.
- Price only. These figures leave out dividends, which would make every return a little better, and inflation, which would make the 1970s look much worse.
- Everyone knows about it. A pattern this widely quoted can be priced in early, which can blunt it in any given year.
- It says nothing about single stocks. Sector leadership changes with the policy outlook, and an index average can hide a rough year for the names you own.
Frequently Asked Questions
How do midterm elections affect the stock market?
Historically, the months before a midterm have been weak and volatile, and the year after has been strong. Since 1946 the S&P 500 fell 18.0% from a high to a low inside the average midterm year, then rose 14.7% on average in the twelve months after Election Day, and it was higher a year later after all 20 midterms.
Does the stock market go up after midterm elections?
It has every time since 1946 when measured over twelve months. Over shorter windows the record is good but not perfect: higher three months later in 18 of 20 midterms and six months later in 19 of 20. Past results do not predict future returns.
When is the 2026 midterm election?
Tuesday, November 3, 2026. Federal elections are held on the Tuesday after the first Monday in November, so the date can fall between November 2 and November 8.
Is the midterm year bad for stocks?
It has been the weakest year of the four year presidential cycle on average. Since 1949 the S&P 500 averaged +4.6% in midterm years with a median of +1.1%, against +17.2% in the year that follows. Some midterm years were excellent, though: 1954 gained 45.0%.
Is a divided Congress good for stocks?
After the 15 midterms since 1946 that left a divided government, the S&P 500 averaged +14.6% over the next year, almost the same as the +14.9% after the 5 that left one party in full control. The end of election uncertainty appears to matter more than the result.
What is the presidential election cycle theory?
It is the observation that stocks have tended to do worst in the first half of a presidential term and best in the second half, with the third year the strongest. Since 1949 the S&P 500 averaged +17.2% in year three of a term and was higher in 17 of 19 of those years.
Every Pure Power Picks alert comes with the reasoning, the key levels and the risk marked on the chart, so you learn how a trade is planned through any election cycle.
Explore more trading guides to keep sharpening your edge.
Disclaimer: Pure Power Picks is not a licensed financial advisor. All content is for educational and informational purposes only and should not be considered investment advice. Options trading involves substantial risk of loss and is not suitable for all investors. Past performance does not guarantee future results. Election year statistics describe history and do not predict future market returns.
Share

The PPP Team is the research and editorial team behind Pure Power Picks. We trade stocks and options and publish the work as we do it, with every alert tracked in public. Publishing since 2020. How we research and correct our work is written out in our editorial standards. Our content is strictly educational, never advice.