


What is Quantitative Trading?
Quantitative trading is a systematic approach to the markets that uses math, statistics, and computer code to decide what to trade, when to act, and how much risk to take. Instead of relying on gut feel or headlines, a quant trader turns an idea into a precise rule, tests that rule against historical data, and then follows it with discipline. The edge, if one exists, comes from finding repeatable patterns that humans tend to miss or execute inconsistently.
In this guide, we will walk you through how quantitative trading works, the core strategies and models behind it, how quants manage risk, and how you can borrow quant thinking for your own options trading, even without a PhD or a server farm.
Quantitative trading replaces opinions with testable rules. Its power comes from consistency, measurement, and risk control, not from prediction magic. Any trader can adopt the quant mindset by defining rules clearly, tracking data honestly, and sizing risk with math.
How Does Quantitative Trading Work?
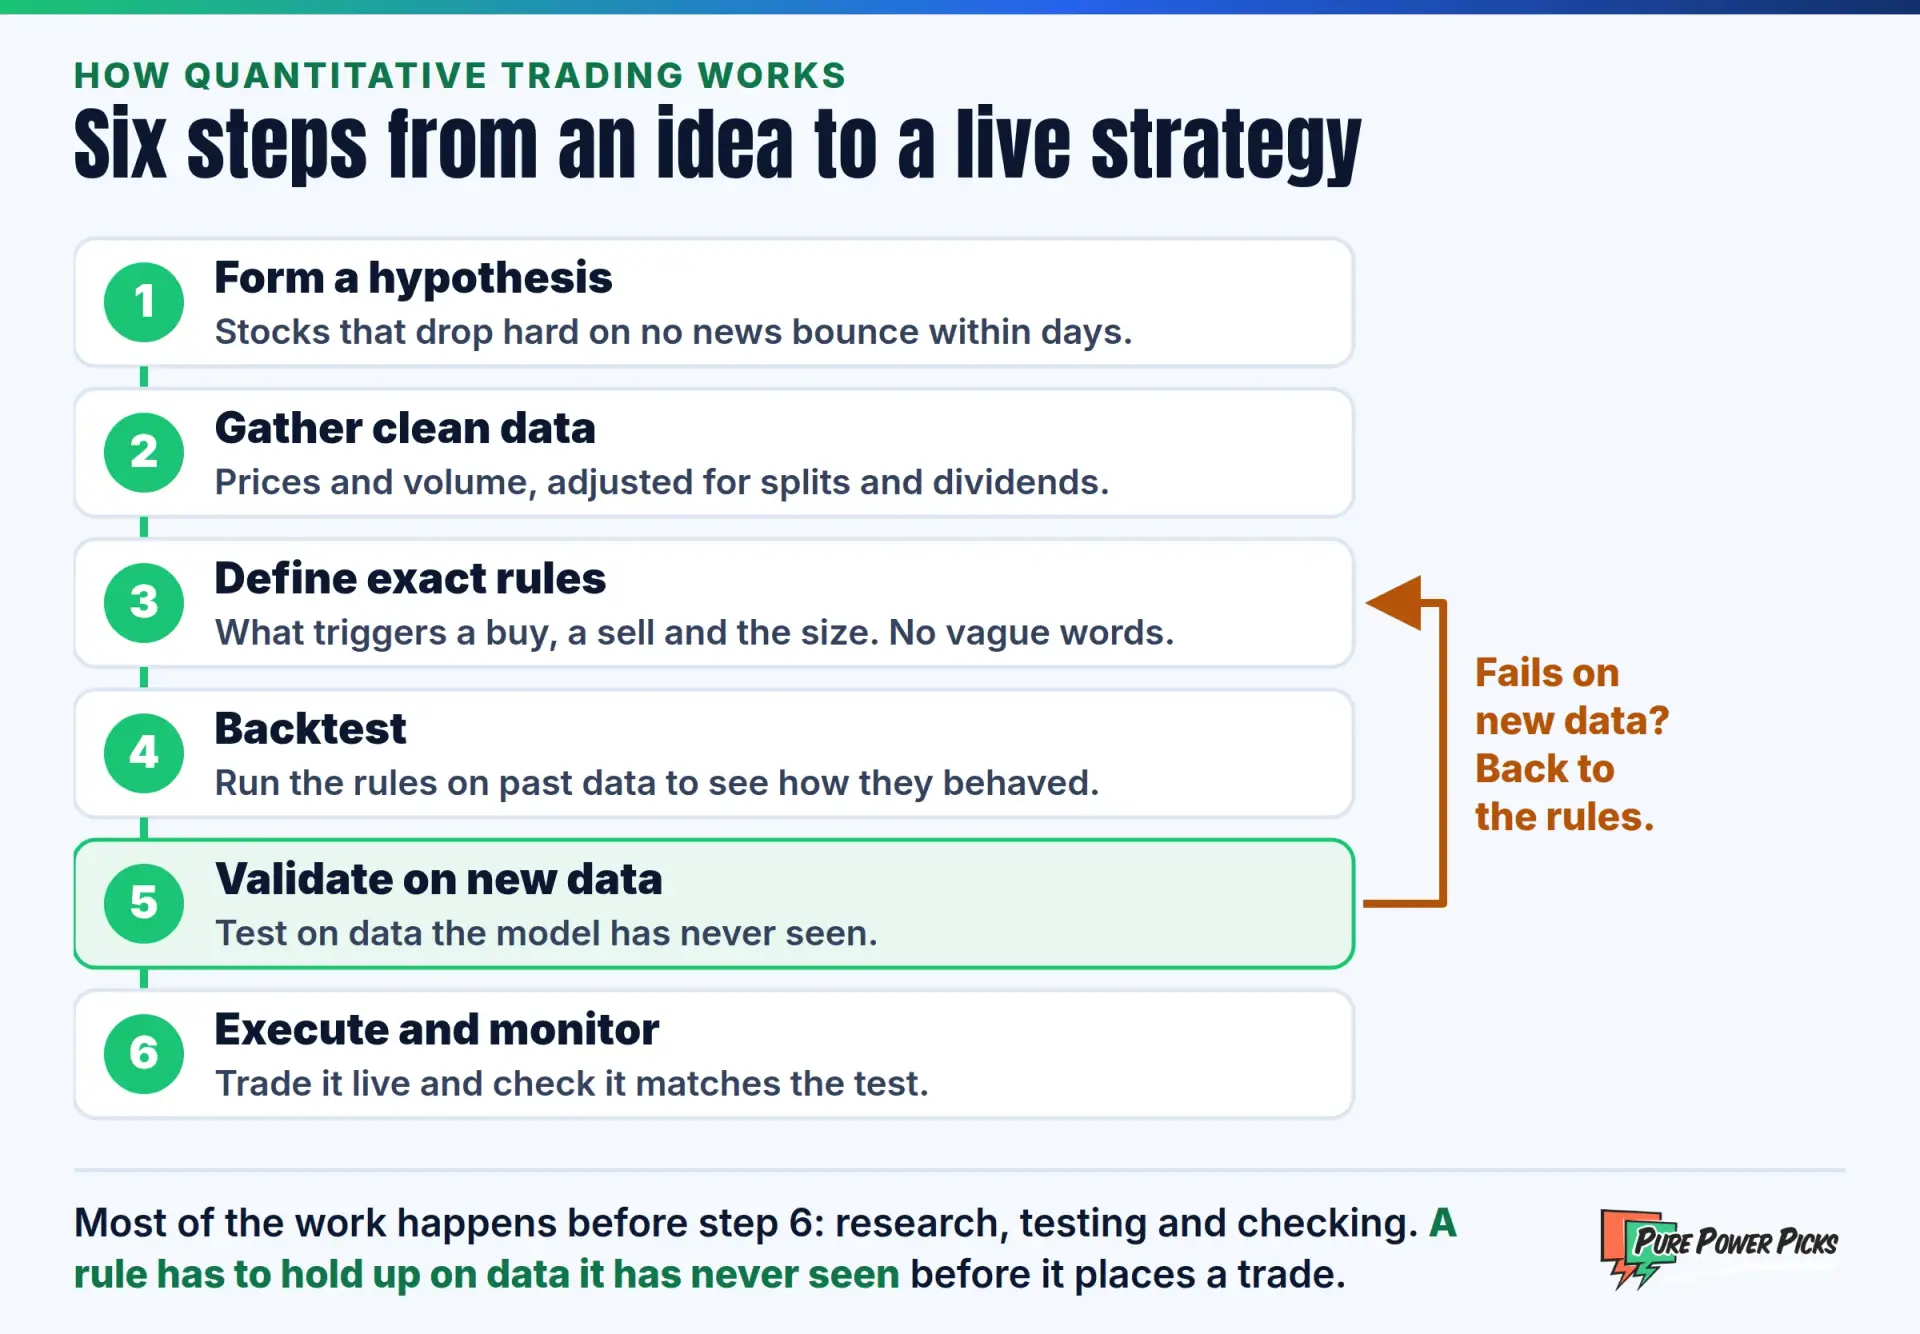
Quantitative trading works by moving an idea through a repeatable pipeline: hypothesis, data, rules, testing, and execution. Every step is measured, so you know exactly why a trade happened and whether the logic still holds.
Here is the typical workflow a quant follows:
- Form a hypothesis. For example: “Stocks that drop sharply on no news tend to bounce within a few days.”
- Gather clean data. Historical prices, volume, and any other inputs the idea needs, adjusted for splits and dividends.
- Define exact rules. What triggers a buy, what triggers a sell, and how much capital goes into each trade. No vague language allowed.
- Backtest. Run the rules against past data to see how they would have behaved.
- Validate out of sample. Test on data the model has never seen to check that the pattern is real.
- Execute and monitor. Run the strategy, often automatically, and track whether live behavior matches the test.
Notice that “predicting the market” is not on the list. Quants accept that any single trade is uncertain. They focus on whether a rule produces a positive expectancy across hundreds of trades.
Backtesting is the process of applying a set of trading rules to historical data to estimate how the strategy would have performed. It is a research tool, not a guarantee. Investopedia has a solid primer on how backtesting works and its limits.
What Are the Main Quantitative Trading Strategies?
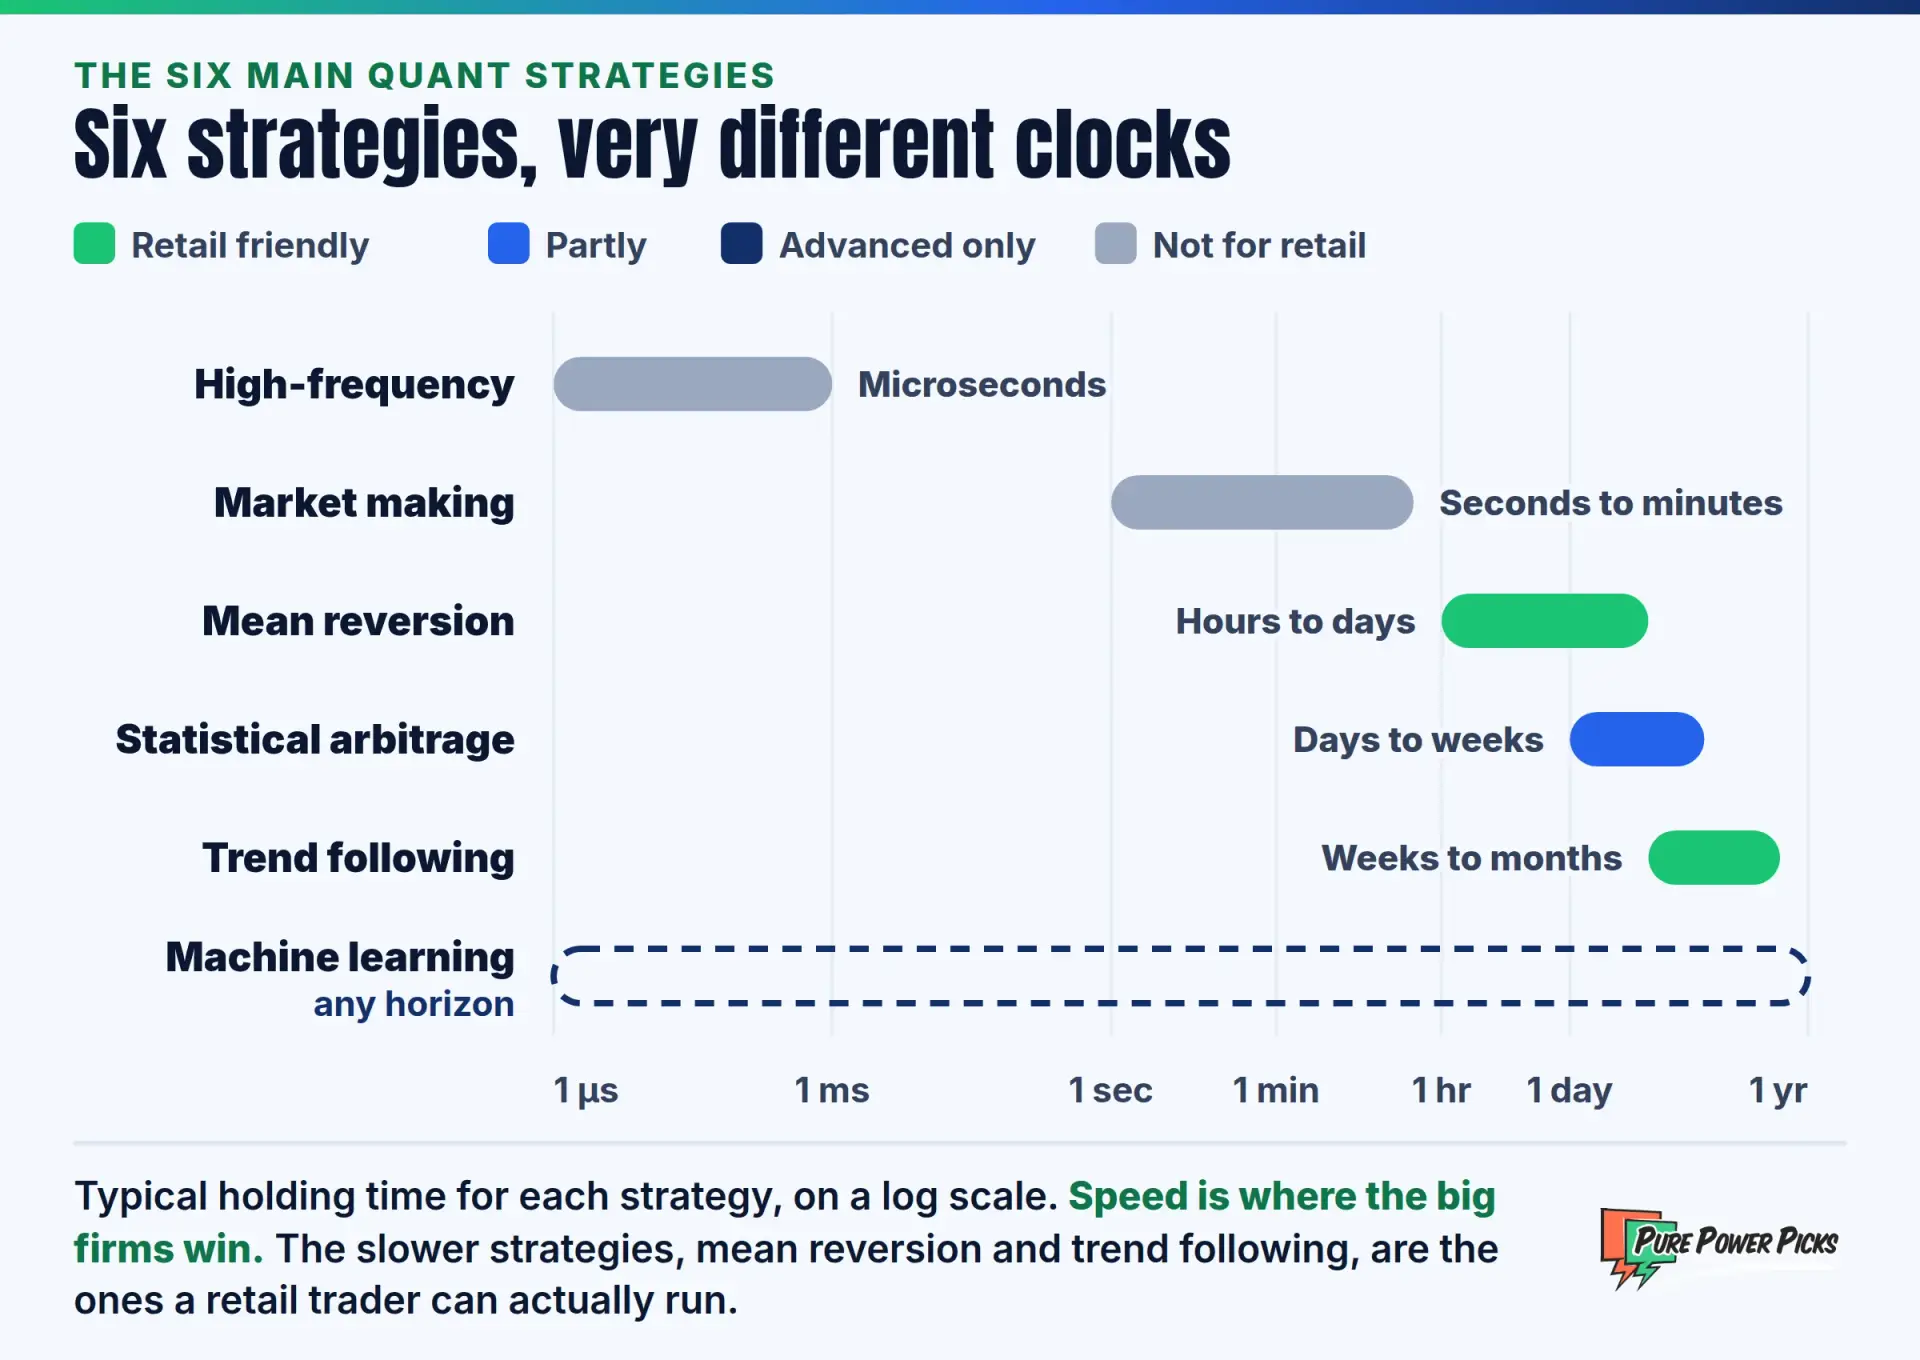
The six core quant strategies are statistical arbitrage, high-frequency trading, mean reversion, trend following, machine learning, and market making. Each one targets a different kind of market inefficiency and demands a different level of speed, capital, and technology.
Statistical arbitrage looks for related assets whose prices drift apart from their usual relationship, then bets on that gap closing. A classic version is pairs trading, where you go long one stock and short a closely correlated peer. You can read more on statistical arbitrage at Investopedia.
Mean reversion assumes prices tend to snap back toward an average after stretching too far. Trend following assumes the opposite over longer horizons: strong moves tend to persist, so you ride the direction until the trend breaks. Both can be built from popular technical indicators like moving averages, Bollinger Bands, and RSI.
High-frequency trading (HFT) exploits tiny, fleeting price differences using ultra-fast systems that operate in microseconds. Market making continuously quotes both a bid and an ask, earning the spread between them while managing inventory risk. Decades ago this was a floor-trader job built on experience. Today it is dominated by algorithms. Machine learning uses models that learn patterns from large data sets and can adapt as conditions shift.
If you want a deeper look at how several of these get coded into rules, check out our breakdown of the best algorithmic trading strategies.
What Models Power Quantitative Trading?
Quant models fall into a few families: statistical models, technical rule-based models, factor models, and machine learning models. Most professional systems blend several of them.
- Statistical models measure relationships like correlation, cointegration, and z-scores to spot when something is unusually far from normal.
- Technical rule-based models translate chart concepts into code. If you are new to this layer, start with what technical indicators are and how they generate signals.
- Factor models rank stocks by traits such as value, momentum, quality, or size. Many of these factors come straight from fundamental analysis, just scored numerically.
- Volatility models estimate how much an asset is likely to move, which is critical for options pricing and risk budgeting.
- Machine learning models such as decision trees and neural networks search for nonlinear patterns, but they are the most prone to finding noise that looks like signal.
The model is only as good as its data. Survivorship bias, look-ahead bias, and bad price feeds have quietly broken more quant strategies than flawed math ever has.
How Do Quantitative Traders Manage Risk?
Quants manage risk with rules defined before a single trade is placed: fixed risk per trade, portfolio exposure limits, and automatic shutoffs when a strategy behaves outside its tested range. Risk management is not a separate step. It is built into the code.
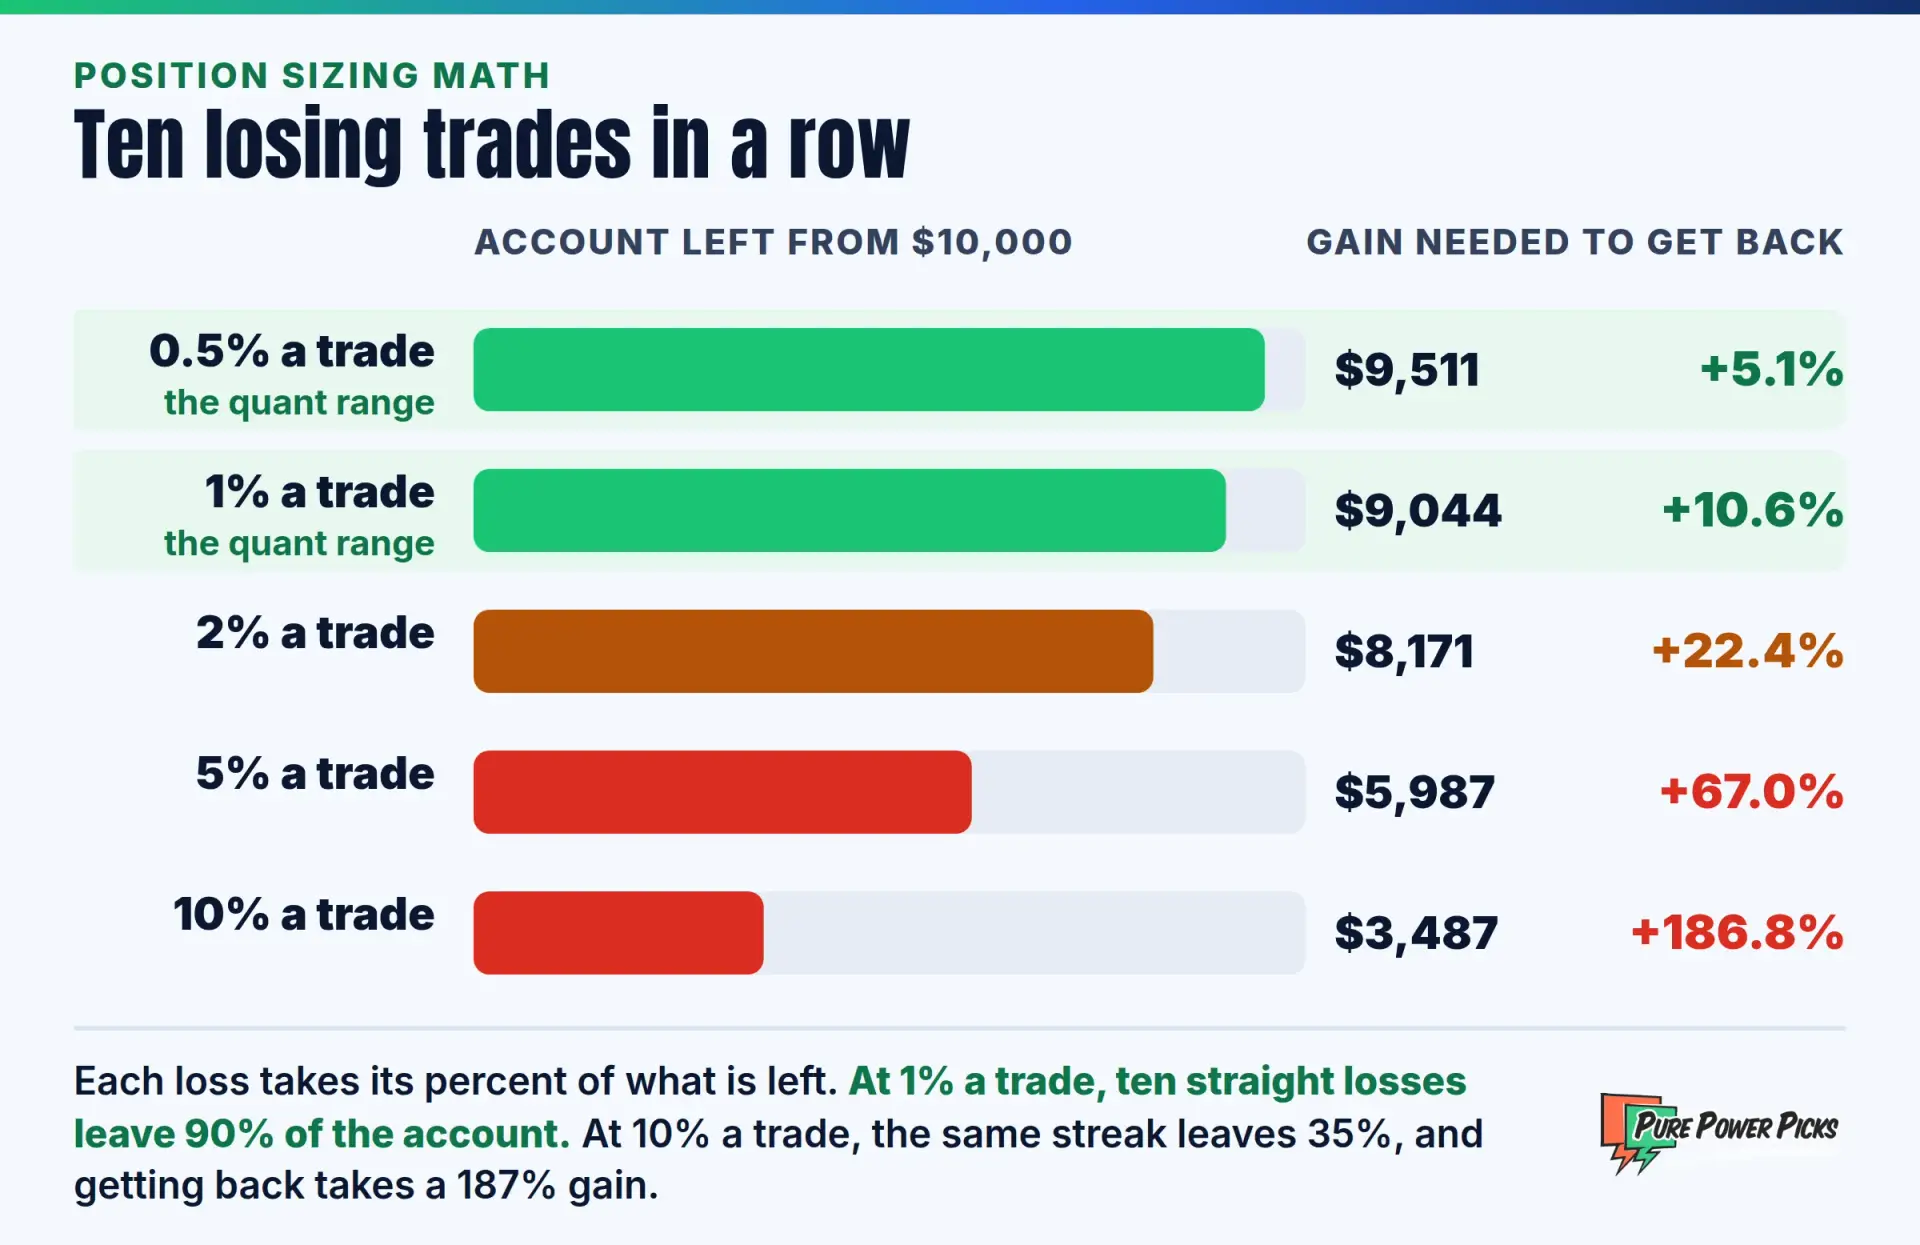
The foundation is position sizing math. A quant might risk a fixed 0.5% to 1% of capital per trade, so no single loss can do serious damage. They also measure every result in units of risk, often by measuring trades in R-multiples, which makes strategies comparable regardless of account size.
Other common controls include maximum drawdown limits, correlation caps so you are not making the same bet five times, and volatility scaling that shrinks size when markets get wild.
Overfitting is the silent account killer. If you tweak parameters until a backtest looks perfect, you have likely tuned the model to past noise. Strategies also fail when market regimes change, and automated systems can amplify errors at machine speed. The SEC’s staff report on algorithmic trading covers how these systems can affect market stability.
What Does Quantitative Trading Look Like in Practice?
In practice, quantitative trading is mostly research and monitoring, not frantic clicking. You spend far more time cleaning data, testing ideas, and reviewing results than actually placing orders.
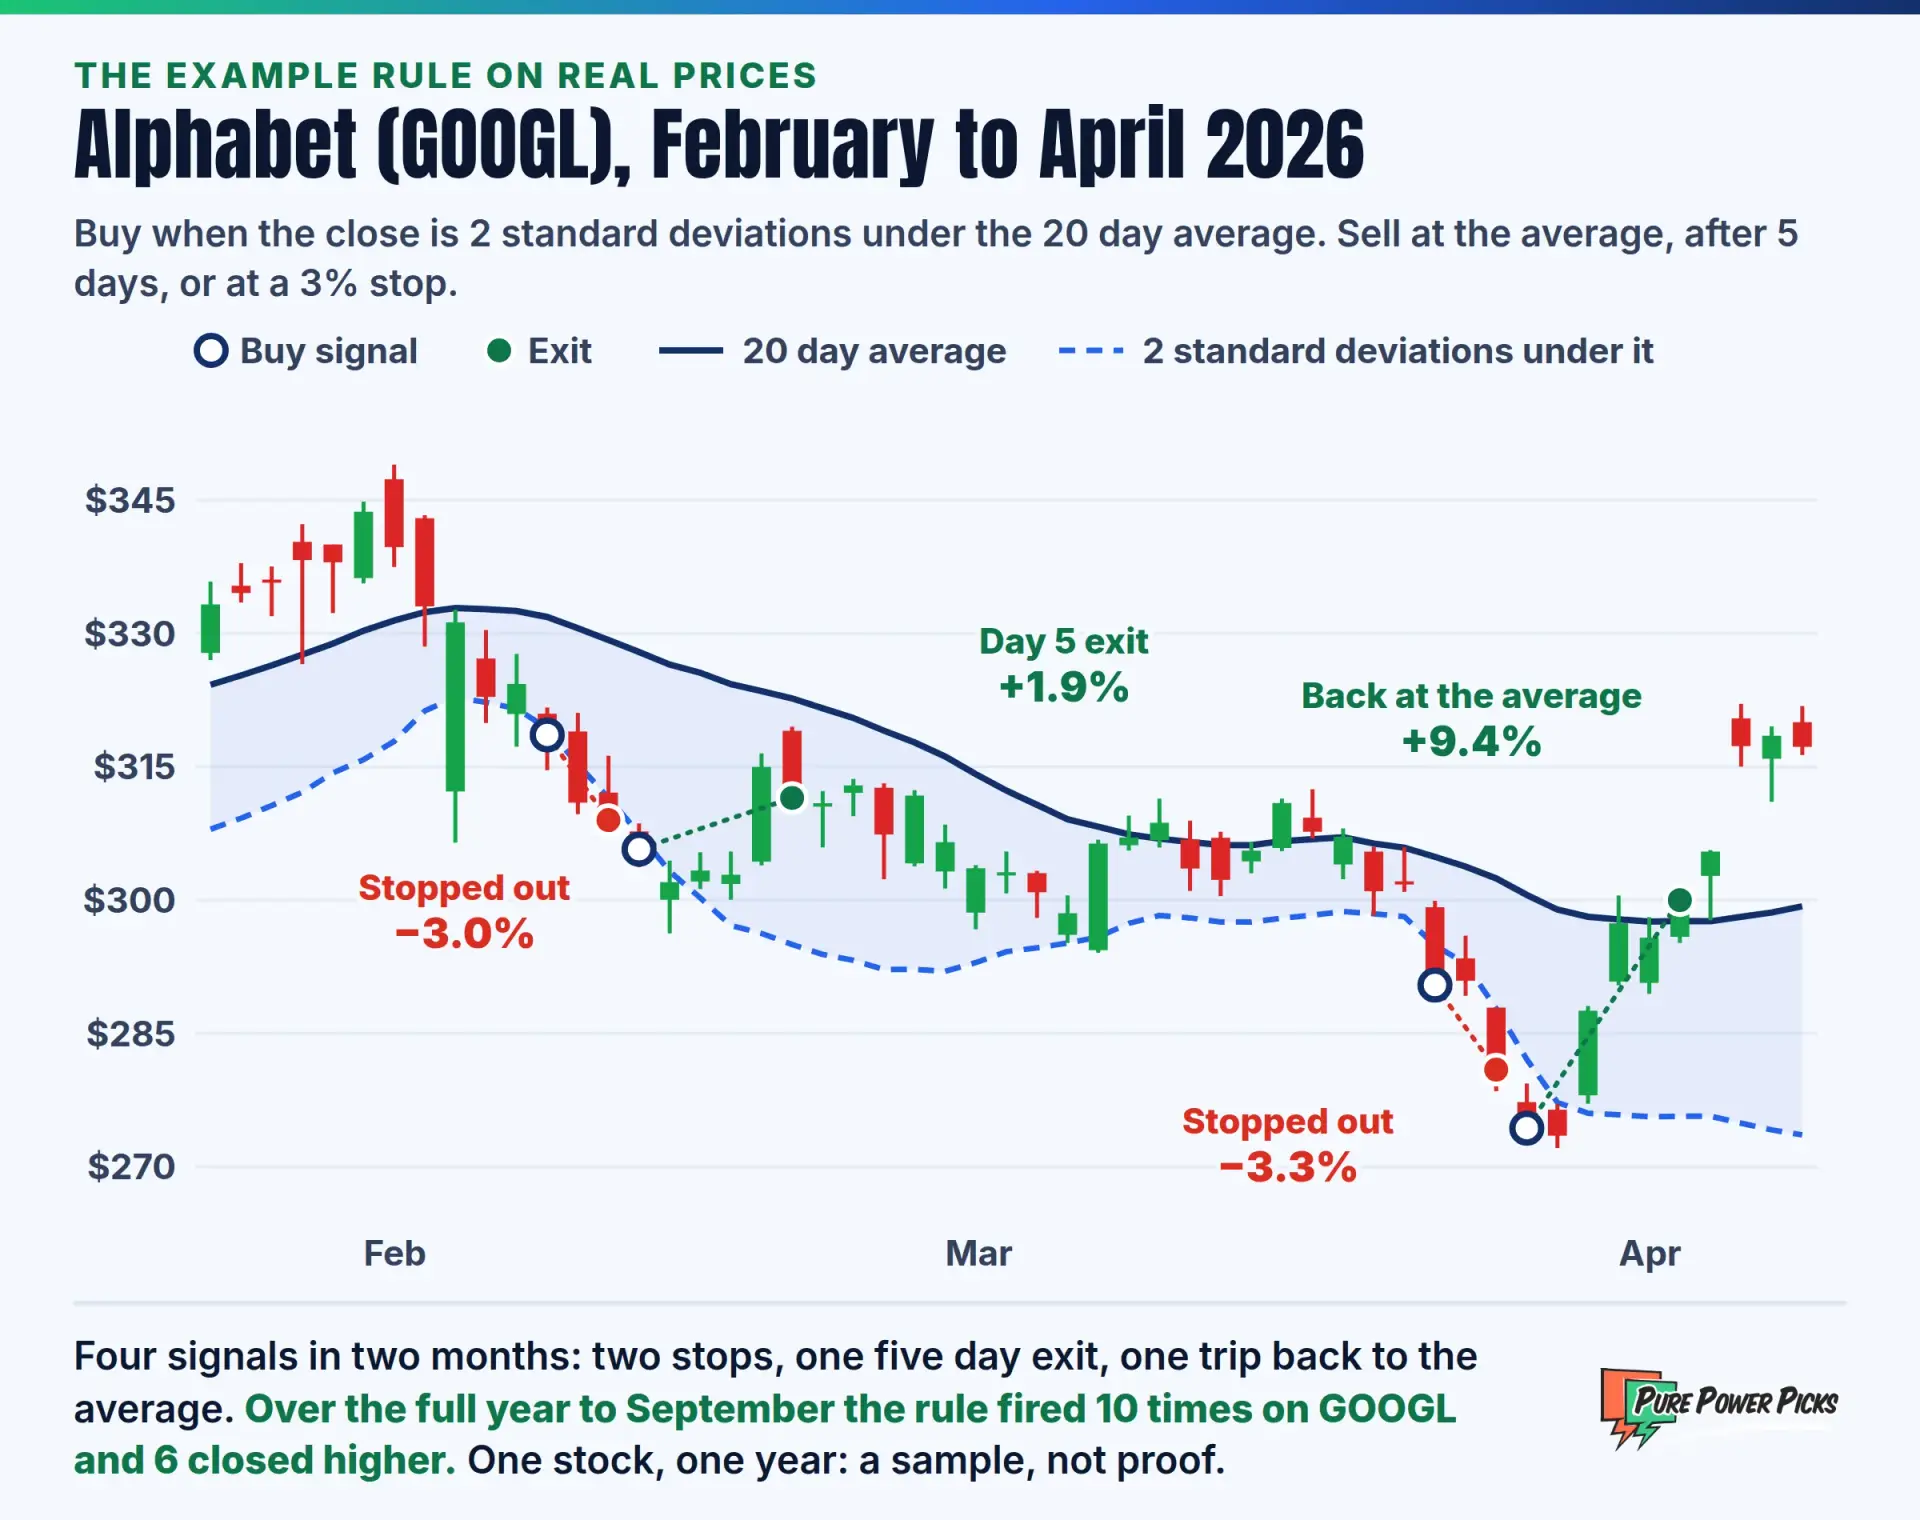
Let’s walk through a hypothetical scenario to make it concrete. Say you want to test a simple mean reversion rule on a hypothetical stock trading around $100.
- Buy rule: price closes 2 standard deviations below its 20-day average.
- Sell rule: price closes back at the 20-day average, or after 5 trading days, whichever comes first.
- Stop rule: close the trade if price falls a further 3% from the buy signal.
- Risk rule: risk no more than 1% of the account per trade.
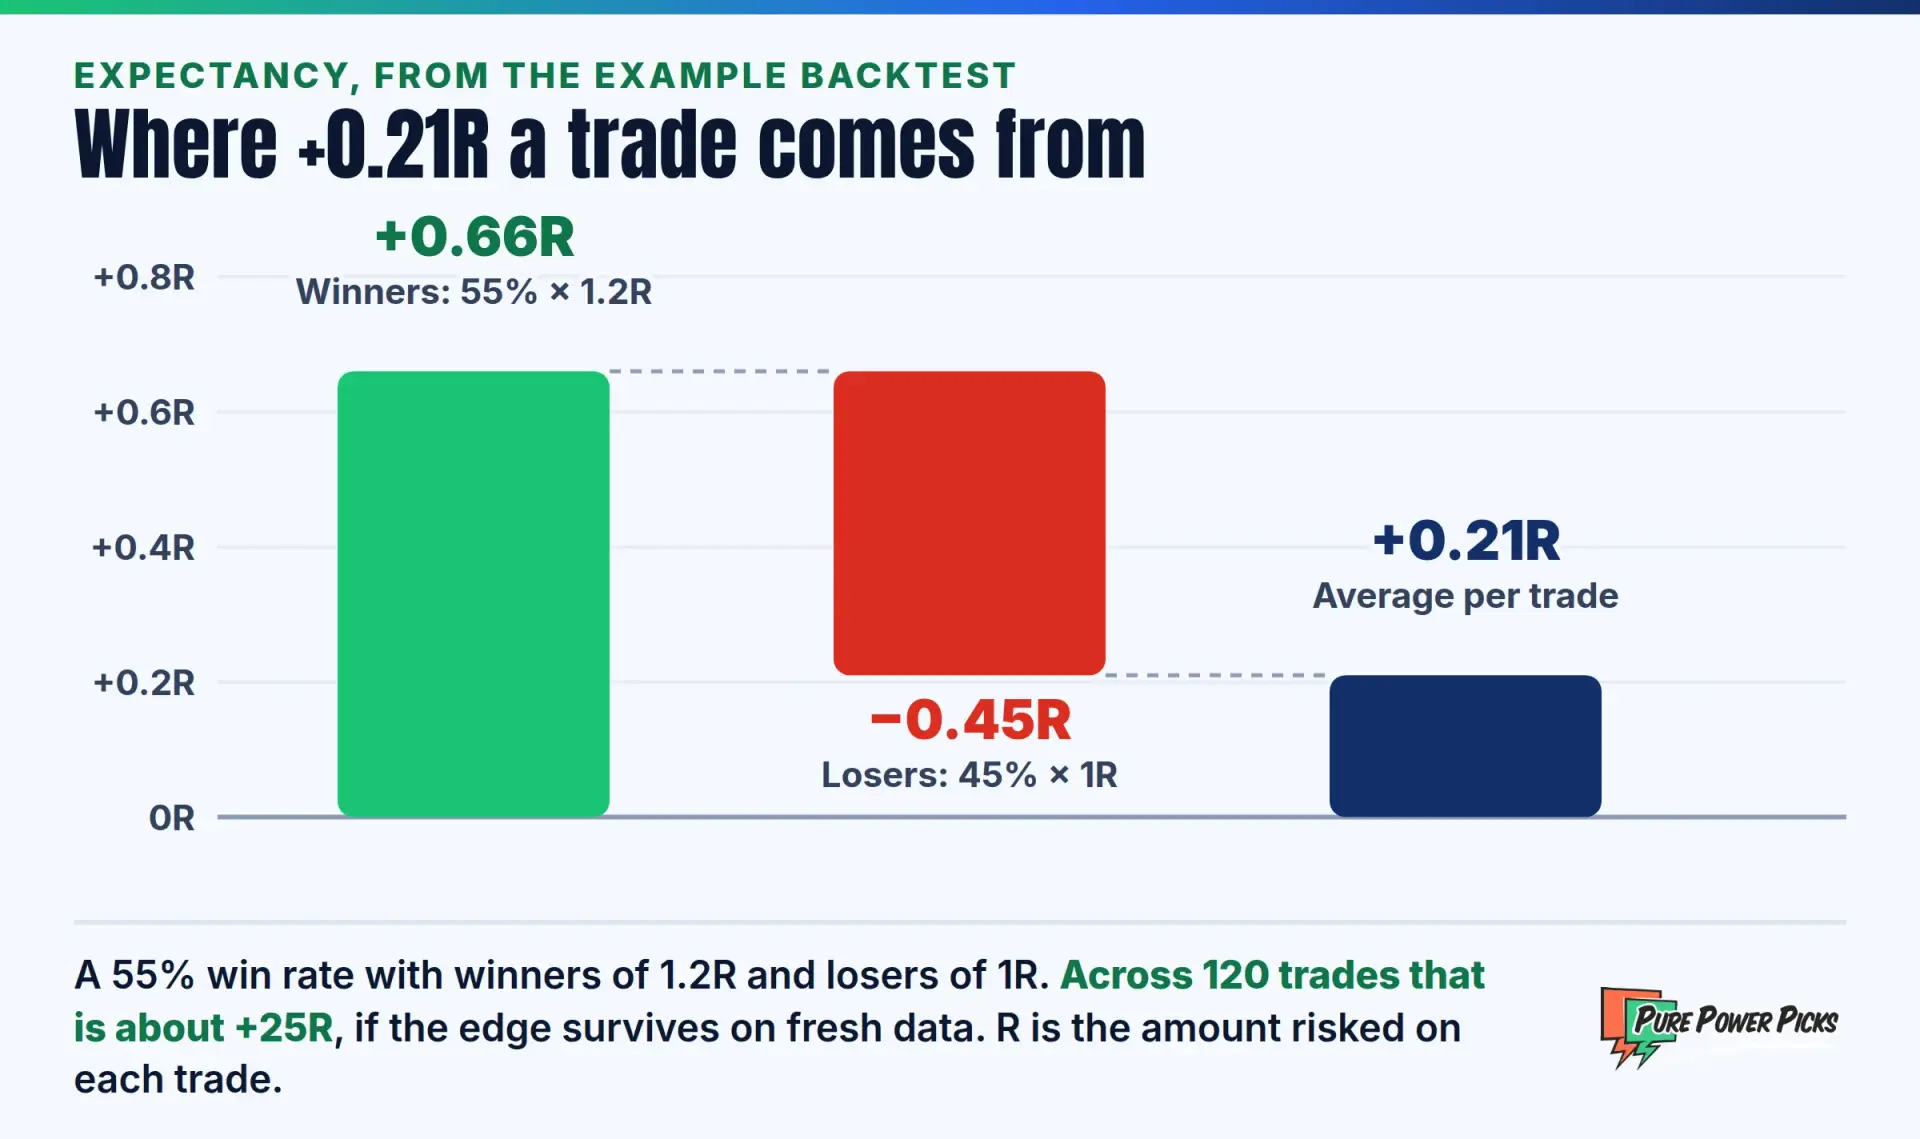
Now you backtest it. In this hypothetical, imagine the rule fires 120 times over several years of data. Rather than staring at the best few trades, you look at the whole distribution: win rate, average winner and average loser in R, the largest drawdown, and how results changed across bull, bear, and sideways stretches.
Suppose the hypothetical test shows a 55% win rate with an average winner of 1.2R and an average loser of 1R. That works out to a modest positive expectancy of roughly 0.21R per trade. The next step is not to celebrate. It is to run the same rules on fresh data and see whether that edge survives. Understanding your risk-reward ratio alongside win rate is what makes this kind of evaluation possible.
Before you write a line of code, write your rules in plain English inside a rules-based trading plan. If you cannot explain a rule in one sentence, a computer cannot execute it either. Clarity first, automation second.
Can Retail Options Traders Use Quantitative Thinking?
Yes. You probably cannot compete with HFT firms on speed, but you can absolutely adopt the quant habits that matter most: defined rules, honest data, and disciplined sizing. Those habits give you an advantage over traders who act on impulse.
Here is how to bring the quant mindset into your options process:
- Filter systematically. Use stock trading scanners with fixed criteria instead of browsing randomly for setups.
- Define your signals. Know exactly what qualifies as one of your buy and sell signals before the market opens.
- Track everything. Your journal is your personal data set. Tracking your trade data lets you calculate your own win rate and expectancy instead of guessing.
- Respect volatility. Options are priced on expected movement, so pay attention to implied volatility before you choose a strike or expiration.
- Know yourself. Quant styles suit some personalities better than others. Our guide to different types of traders can help you see where you fit.
You do not need to automate anything to think like a quant. A spreadsheet, a clear rule set, and the discipline to follow it will put you ahead of most discretionary traders.
Frequently Asked Questions
Is quantitative trading the same as algorithmic trading?
They overlap but are not identical. Quantitative trading is about using math and data to decide what to trade. Algorithmic trading is about using code to execute orders automatically. Most quant strategies are executed algorithmically, but an algorithm can also simply automate a discretionary trader’s orders.
Do I need to know how to code to be a quant trader?
To build and automate full strategies, coding skills in Python or R help enormously. To apply quant principles to your own trading, you mainly need clear rules, a spreadsheet, and consistent record keeping. Many traders start without code and learn it later.
What is the biggest mistake beginners make with quant strategies?
Overfitting. Beginners often adjust parameters until a backtest looks flawless, then watch the strategy struggle on new data. Always validate on data the model has not seen, and be suspicious of results that look too smooth.
Does quantitative trading work for options?
Options are inherently quantitative, since their prices depend on models that factor in volatility, time, and interest rates. Quant thinking helps you evaluate implied volatility, size risk precisely, and compare setups objectively. Options still carry significant risk, including the potential to lose the full premium paid.
Can quantitative trading guarantee consistent results?
No. Quantitative methods improve consistency in process, not certainty in outcomes. Market regimes change, edges fade as others discover them, and even well-tested models experience drawdowns. Treat any strategy as a probability, never a promise.
Build Your Process With Pure Power Picks
Quant traders win on process, and so can you. Pure Power Picks shares educational options chart setups and ideas, each with an alert price, clear reasoning, and risk context, so you can study how structured setups are built and sharpen your own rules over time.
If you want a steady stream of setups to learn from while you develop your own data-driven approach, explore the membership options.
See Membership Plans
The PPP Team is the research and editorial team behind Pure Power Picks. We trade stocks and options and publish the work as we do it, with every alert tracked in public. Publishing since 2020. How we research and correct our work is written out in our editorial standards. Our content is strictly educational, never advice.
Disclaimer: The content on Pure Power Picks is for educational and informational purposes only and does not constitute financial, investment, or trading advice. We are not registered financial advisors. Examples in this article are hypothetical or historical and are provided solely to illustrate concepts. Options trading involves substantial risk and is not suitable for every investor; you can lose some or all of your invested capital. Past performance, including any historical alert data, does not guarantee future results. Always do your own research and consult a licensed financial professional before making any investment decisions.