

3 Trading Strategies with Pivot Points
Pivot points are one of the cleanest ways to map out where price is likely to stall, bounce, or break during a trading session. If you have ever stared at a chart wondering where support and resistance actually live, this is the tool that answers that question with math instead of guesswork. Pivot points take the previous session’s high, low, and close and turn them into a set of horizontal levels you can trade around. In this guide we will walk you through what pivot points are, how to calculate them, and three practical strategies you can use to build cleaner setups. The goal here is not memorization. It is giving you a repeatable framework so you can read the market with more confidence.
Pivot points give you a preset map of support and resistance built from yesterday’s price action. Use the central pivot to gauge daily bias, then trade bounces and breaks at the R and S levels around it. The tool works best when you pair it with confirmation like candlesticks, volume, or momentum, not on its own.
| Indicator type | Support / resistance mapping |
| Core inputs | Prior high, low, close |
| Key levels | PP, R1-R3, S1-S3 |
| Best timeframes | Intraday, swing |
| Pairs well with | Candlesticks, VWAP, RSI |
| Skill level | Beginner to intermediate |
What Are Pivot Points and Why Do Traders Use Them?
Pivot points are horizontal price levels calculated from the previous session’s data that act as objective zones of support and resistance levels. Instead of drawing lines by hand and hoping you got them right, the math draws them for you.
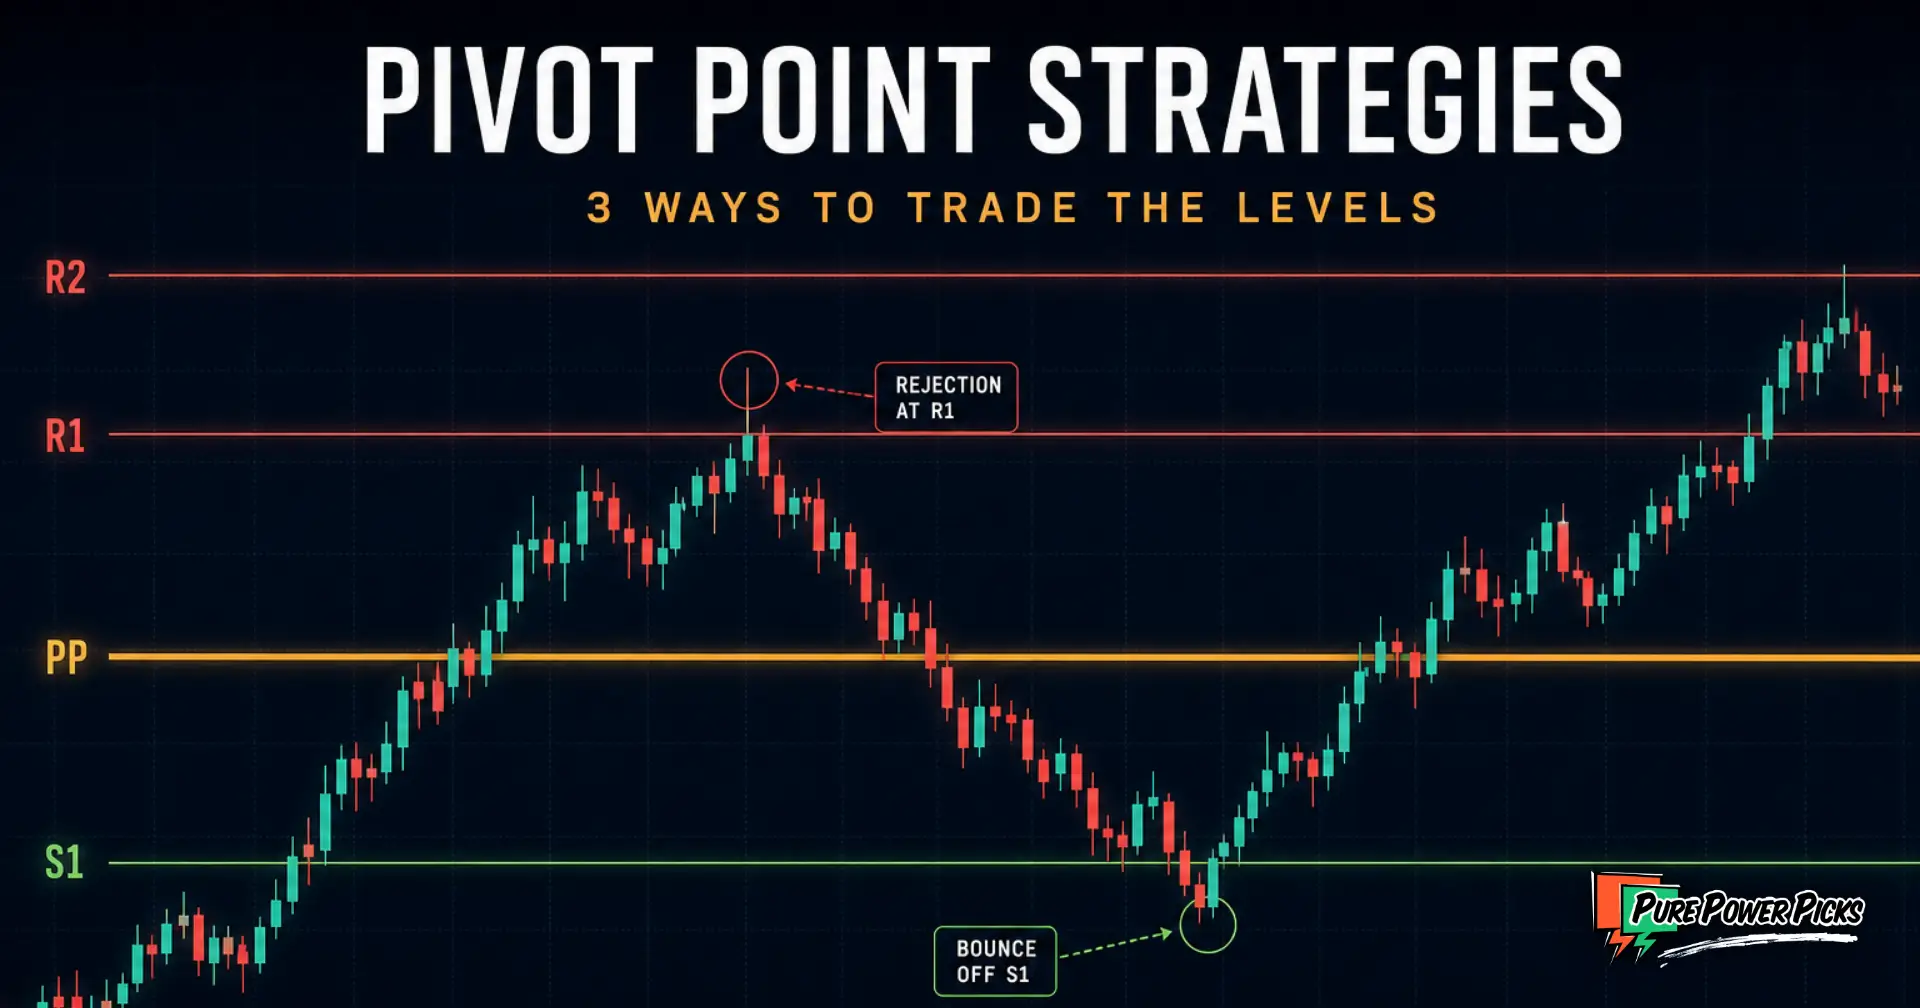
The central line is the pivot point itself, often written as PP. Above it sit resistance levels R1, R2, and R3. Below it sit support levels S1, S2, and S3. When price trades above the PP, the session is generally viewed as bullish. When it trades below, the bias leans bearish. That simple read alone gives you a starting frame for the day.
What makes these levels useful is that a huge number of traders watch them. That shared attention tends to make the levels react. Price often hesitates at R1 or bounces off S1 simply because enough participants are watching the same lines. It becomes a self reinforcing map of where decisions get made.

Pivot Point (PP): A calculated reference level equal to the average of the prior session’s high, low, and close. It serves as the anchor from which all support and resistance levels are derived.
How Do You Calculate Pivot Points?
The standard pivot point is the average of yesterday’s high, low, and close. From there, you build the support and resistance levels with a handful of simple formulas.
Here is the core set of standard (also called floor trader) formulas:
R1 = (2 × PP) – Low
S1 = (2 × PP) – High
R2 = PP + (High – Low)
S2 = PP – (High – Low)
R3 = High + 2 × (PP – Low)
S3 = Low – 2 × (High – PP)
The good news is you rarely have to do this by hand. Almost every charting platform plots pivots automatically once you add the indicator. Still, understanding the math helps you trust the levels and adjust the calculation type when you need to. You can read more about the standard formula on Investopedia’s pivot point overview.
There are several pivot variations beyond the standard set. The camarilla pivot system uses tighter levels built for range trading, while fibonacci trading indicator ratios can be layered onto pivots for extra structure. Test which style fits your market and timeframe.
What Are the Three Core Pivot Point Trading Strategies?
The three most common approaches are the candlestick pivot strategy, the pivot bounce strategy, and the pivot breakout strategy. Each one uses the same levels but reads them differently depending on how price is behaving.

1. The Candlestick Pivot Strategy. This method combines pivot levels with candlestick reversal patterns. When price reaches a pivot level and prints a strong reversal candle, such as a hammer at S1 or a shooting star at R1, that confluence gives you a higher quality signal than the level alone.
2. The Pivot Bounce Strategy. This works best in ranging or choppy markets. You look for price to approach a support or resistance level and reject it, then trade back toward the central pivot. It is a mean reversion style approach that treats the levels as walls.
3. The Pivot Breakout Strategy. When momentum is strong, price slices through a pivot level instead of bouncing. A clean break of R1 on rising volume can signal continuation toward R2. This suits trending days and works well with clear buy and sell signals.
The skill is knowing which strategy the market is asking for. Ranges reward bounces. Trends reward breakouts. Candlestick confirmation improves both. Pairing pivots with using vwap can help you gauge whether the day is trending or rotating.
Why Are Pivot Points So Important for Timing?
Pivot points matter because they give you predefined levels before the session even opens, which removes emotion and improvises less. You plan your reactions instead of chasing price.
Because the levels are known in advance, you can build your plan around them. You know where you would consider a setup, where you would step aside, and where the idea is wrong. That structure is what separates a repeatable process from random clicking.
Pivots also stack cleanly with your risk-reward ratio planning. If price is near S1 and your invalidation sits just below S2, you can measure the risk against the distance to the central pivot before you ever commit. Add trailing stops to protect profits as price moves through levels and you have a full framework.

What Does a Hypothetical Pivot Setup Look Like?
Let’s walk through a hypothetical scenario to make the framework concrete. This is an illustration only, not a real trade or recommendation.
Imagine a stock closed the prior day with a high of 102, a low of 98, and a close of 100. The pivot works out to (102 + 98 + 100) / 3, or 100. S1 lands near 98 and R1 lands near 102.
The next morning, price drifts down to the 98 area, tags S1, and prints a bullish hammer on solid volume. That is the candlestick pivot strategy in action: a known level plus a reversal signal. A trader following this framework might plan a move back toward the 100 pivot, with the idea invalidated on a clean break below S1. Notice how the levels define both the target zone and the point where the thesis fails. That is the entire value of the tool.
Pivot points are not magic lines. Price can slice straight through a level, fake a bounce, then reverse. Never trade a level in isolation. Always confirm with price action or momentum, size your risk before you commit, and accept that any level can fail.
How Do Pivot Points Compare to Other Level Tools?
Pivots are one of several ways to define support and resistance, and each tool has a different personality. Here is a quick comparison to help you choose.
| Tool | Basis | Best For |
|---|---|---|
| Standard Pivots | Prior high, low, close | Daily bias and intraday levels |
| Camarilla | Prior range with multipliers | Tight range and reversal trading |
| Fibonacci Levels | Swing high to swing low ratios | Retracements in trends |
| VWAP | Volume weighted average price | Intraday value and fair price |
None of these replaces the others. Many traders layer pivots with momentum tools like how to use rsi and study a broader set of best trading indicators to build a full read. If you want to sharpen the visual side, our guide on charting stocks pairs nicely with this one. For swing setups, review our top swing trading setups and how pivots fit into them. You can also explore additional context in this popular technical indicators overview.
Frequently Asked Questions
Do pivot points work for both stocks and options?
Yes. Pivots plot on the underlying stock chart, and options traders use those same levels to time contract decisions around the stock’s price behavior. The levels describe the stock, but they inform how you approach the option.
Which timeframe should I calculate pivots from?
Daily pivots built from the prior day are the most common for intraday trading. Swing traders often use weekly pivots for a bigger picture map. Match the pivot period to your holding time.
Are pivot points a leading or lagging indicator?
Pivots are leading in the sense that they are calculated before the session and give you levels in advance. They do not predict direction on their own, though. They tell you where reactions are likely, and you confirm the direction with price action.
Can I use pivot points alone?
You can, but it is not ideal. Pivots are strongest when combined with confirmation like candlesticks, volume, or momentum. Using them in isolation leaves you exposed to false signals.
Why do prices react at pivot levels?
Largely because so many traders watch the same math. When a wide group of participants sees the same level, their collective decisions tend to create real reactions there. It is partly mechanics and partly shared attention.
Learn to Read Levels Like a Pro
Pivot points are just the start. At Pure Power Picks we teach traders how to combine levels, momentum, and clean chart setups into a repeatable process, with educational alerts that show you the thinking behind each idea.
See Alert Pricing & PlansDisclaimer: Pure Power Picks provides educational content only. We are not financial advisors, and nothing in this article is financial, investment, or trading advice. All examples described here are hypothetical and for educational purposes only. They do not represent real trades, real results, or any specific recommendation. Trading stocks and options involves substantial risk of loss and is not suitable for every investor. Past performance and hypothetical scenarios do not guarantee future results. Always do your own research and consult a licensed professional before making any financial decisions. For more on market risk, see resources from the U.S. Securities and Exchange Commission and the Cboe options exchange.

The PPP Team is the research and editorial team behind Pure Power Picks. We trade stocks and options and publish the work as we do it, with every alert tracked in public. Publishing since 2020. How we research and correct our work is written out in our editorial standards. Our content is strictly educational, never advice.