PPP_WATCHLIST_LOGO_4thOfJuly

Stocks To Watch – 7/1/2024

Brief Overview

Hello Traders & Investors,

Scroll down to see the stocks we have on watch this week 👀!

Are you ready to kick off the second half of the year? As we get closer to the November Election the markets are heating up and we’re here for it! Markets are closed Thursday and Wednesday the markets will close early 1:00 pm EST in observance of the holiday.

Amazon surpassed the $2 trillion market cap mark on Wednesday becoming the 5th company to reach this milestone. 

Roaring Kitty returned once again having a hand in dog-related stocks like CHWY seeing a huge pop on Thursday.

Friday marked the last day of the quarter with the first Presidential Debate in the books. Action was volatile with investors dealing with looming inflation concerns. It will be an interesting week! 

It’s Free Watchlist Week! Once a month we send the entire Watchlist to everyone for free.

If you’re not yet a member, Sign up now and get every Watchlist, every Week! You will also receive the Pure Power Picks 3-5 Weekly Options Trading Alerts & much more!

In honor of Independence Day🇺🇸, we are offering 30% off with coupon code: JULY4TH at checkout!

Monthly Options Trade Alerts

Was $97/Month
Now $67.90/Month

Quarterly Options Trade Alerts

Was $247/Quarter
Now $172.90/Quarter

Yearly Options Trade Alerts

Was $797/Year
Now $557.90/Year

Already a Member? Current members can use this coupon code to discount their current subscription or upgrade to extend their membership to quarterly or yearly!

Any time remaining in their current subscription will be prorated and applied to the upgrade.

You can upgrade from the subscriptions tab on the Member Dashboard by choosing a different plan. Be sure to use the coupon code JULY4TH when checking out.

If you have any questions, please REPLY DIRECTLY to this email with your questions and our team will be in touch!

Recent Winners Tracking

MRNA +148% Sent on 6/26
PYPL +35%
Sent on 6/24
AMZN +131%
Sent on 6/21
TSLA +94%
Sent on 6/18
AFRM +78%
Sent on 6/17
CLSK +55% Sent on 6/13
CVNA +275%
Sent on 6/12
OXY +65% Sent on 6/10
MBLY +93%
Sent on 6/7
PLTR +114%
Sent on 6/5
*Max gain potential on options alerted so far/before expiration.

View all PPP’s alert performance with the Member’s Only Alert Tracker!

Market Brief

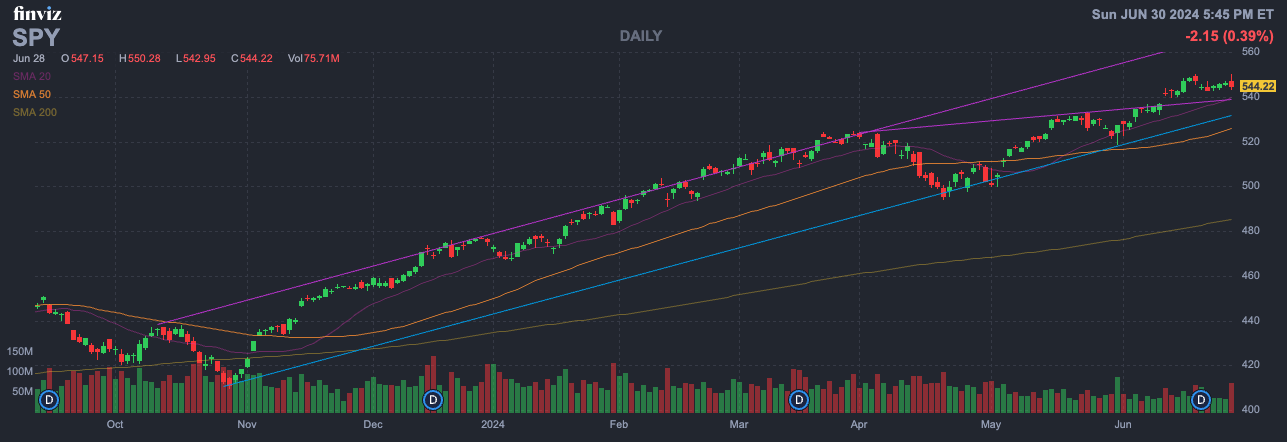
S&P 500 ETF (Ticker: SPY) – Daily Chart

Opened last week at: $544.33
Hit a weekly high of: $550.28 on Fri, 6/28
Hit the low of the week of: $542.21 (postmarket) on Mon,  6/25
Closed the week at: $544.22

Last Week…

Overall SPY traded relatively sideways for the week with the exception of a short ramp up Friday. Falling short or making a new all time high topping out at $550.28 before giving it all back to close out the week at the $544.22 mark just .11¢ off the week’s open price. 

Bullish Perspective
Bulls will want to see a move back over the $550 psych level for a possible test of all time highs at $551.12 for a possible breakout into blue skies. 

Bearish Perspective
With the failure to reach a new high last week before retreating back to support, bears are in a good position for a possible breakdown. Look for support around $540 – 539.75 to break and hold for confirmation of a possible slide back to support around $534 and possibly deeper to $525.50.

SPDR S&P 500 ETF Trust
Daily Chart

Charts Provided By: Finviz

Weekly Stocks to Watch

As always, we’ll be heavily focused on our news feeds & scanners for prime opportunities throughout the week.

Amazon (Ticker: AMZN)

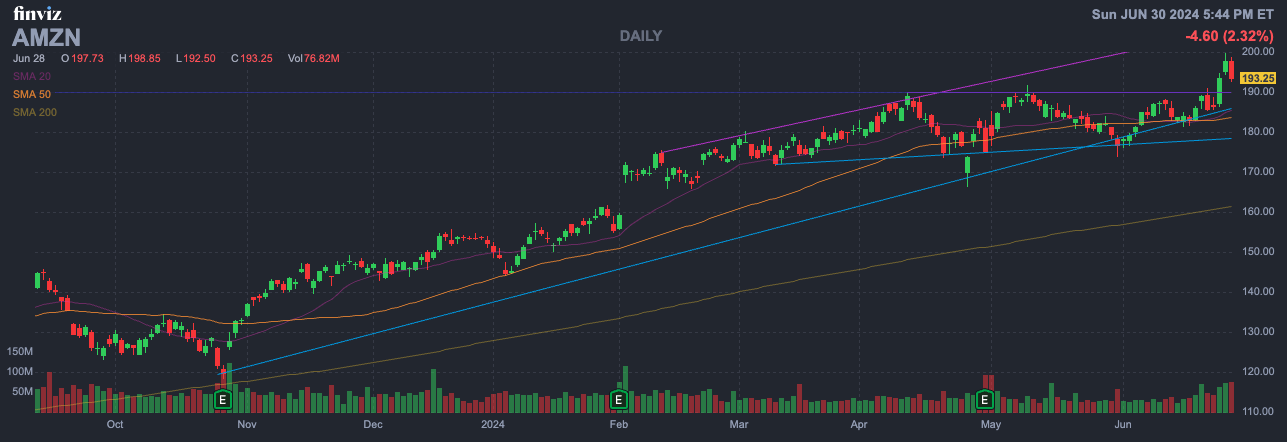
Bullish breakout into ATH last week, we are keeping this as simple as it gets. $190 support / buy opportunities to long this into the future, in anticipation of $200 – 225 – 250 with time ( months for the later targets) But if AMZN moves under $190 and struggles to hold it, there could be moves back into the mid to low 180s to shake out greedy bulls.

Amazon (Ticker- AMZN)
Daily Chart

Tesla Inc. (Ticker: TSLA)

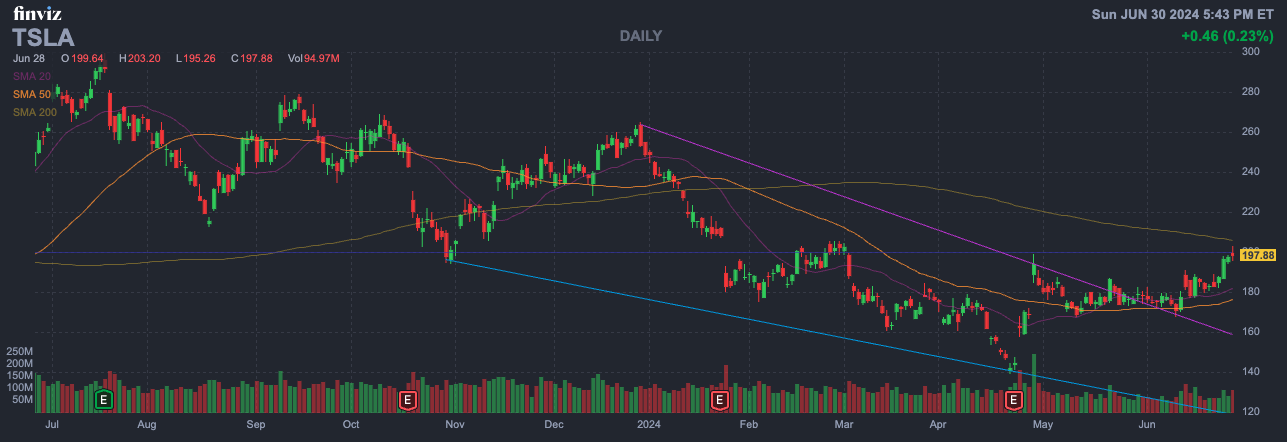
Keeping this simple too, if over $200 holds, upside can be lofty with a break over $203.25. Look for $210 – 220 – 240 targets if $200 holds in the coming weeks. Under $200 and we could see selling back into low 190s – 180s – high 170s.

Tesla Inc. (Ticker- TSLA)
Daily Chart

Rivian Automotive Inc. (Ticker: RIVN)

Interesting after last weeks explosion $10.31 to a post-market high of $18.88. After opening at $16.35 the next day, price action was weak. It faded to the downside and closed the week at $13.42. Watch out if it breaks below $13.21 for a move into short-side targets $13 – 12.5 – 12 – 11.5. However, if the momentum is there & last weeks low finds support, anticipate upside moves. Long-side targets $14.5 – 15 – 16 – 20 in the coming weeks.

Rivian Automotive Inc. (Ticker- RIVN)
Daily Chart

Roblox Corp. (Ticker: RBLX)

After the May earnings move into $29.55, this recovered nicely the past month. Closed the week strong at $37.21. However, there could be possible resistance here! Would look out for $38 – 39 resistance for possible sellers targets $35 – 34 – 32 – 30. But, longs may also be optimistic if $36 range holds support. In this case, look for potential longs to test levels at $38 – 39 – 40 – 42.5.

Roblox Corp. (Ticker- RBLX)
Daily Chart

Geo Group Inc. (Ticker: GEO)

Strong last week, so it’s on the watch for continuation moves. Potential long opportunities over $14.5 are $15 – 16. If $16.31 breaks to upside, GEO can get moving towards $17 – 18 – 19 – 20 targets with time. Bulls will want to see $14 range hold.

Geo Group Inc. (Ticker- GEO)
Monthly Chart

Draftkings Inc. (Ticker: DKNG)

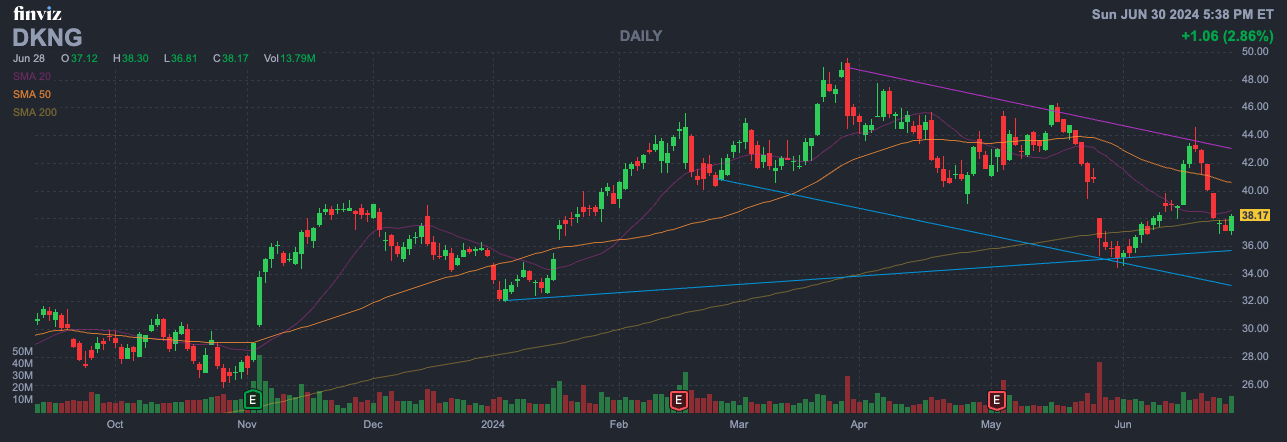
A name we have on watch for bullishness this upcoming week. If DKNG holds $37.5 zone look for potential rips to $40 – 42.5. Bulls need $42.5 to break to see $45 – 50. But, this idea requires this: we want to see $37 hold, if it doesn’t we will look for moves to $35 to be tested. There should be support there, if not, could move to $30 zone.

Draftkings Inc. (Ticker- DKNG)
Daily Chart

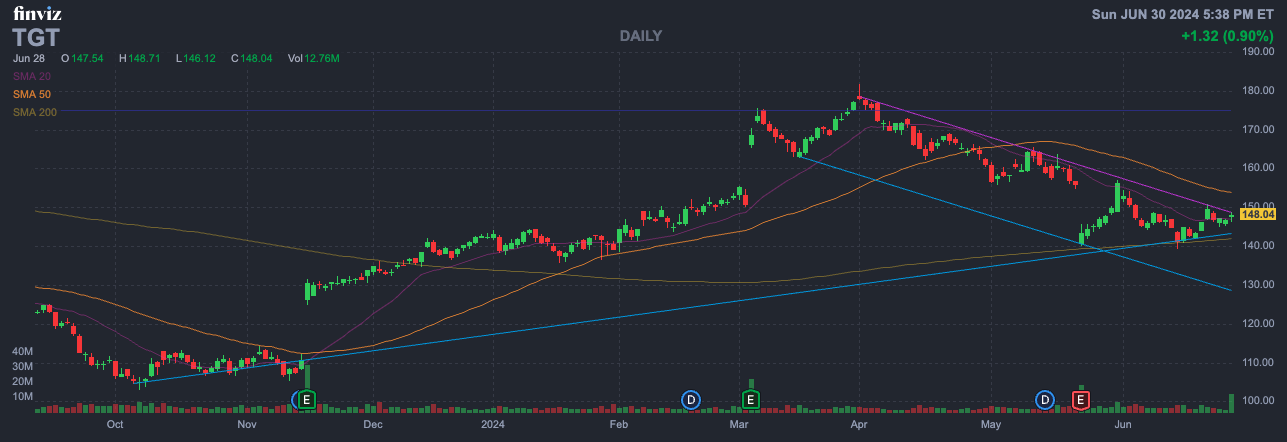
Target (Ticker: TGT)

Simple idea at support that can produce powerful results. Bulls, look for support $145. If this holds, upside targets are $150 – 155 – 157.5 – 160 – 164.5. Potentially can move up towards $175 – 180 with time if market is strong and volume comes into the retail giant. If $145 loses its footing, it may bleed back into low $140s.

Target (Ticker- TGT)
Daily Chart

More on our radar

We will also be keeping eyes on M, SHOP, AMD, SQ, NKE & CHWY as well as more names from past watchlists. Be sure to check up on Past Watchlist write-ups as the levels may still be viable. We’ll be ready to alert any setups to our members as usual! 

We have other names on watch and we’ll continue to monitor our breaking news feeds and Stock & Options Scanners to help make the smartest picks with the most potential throughout the week!

Weekly Market Earnings Calendar

Most Anticipated Earnings Releases This Week

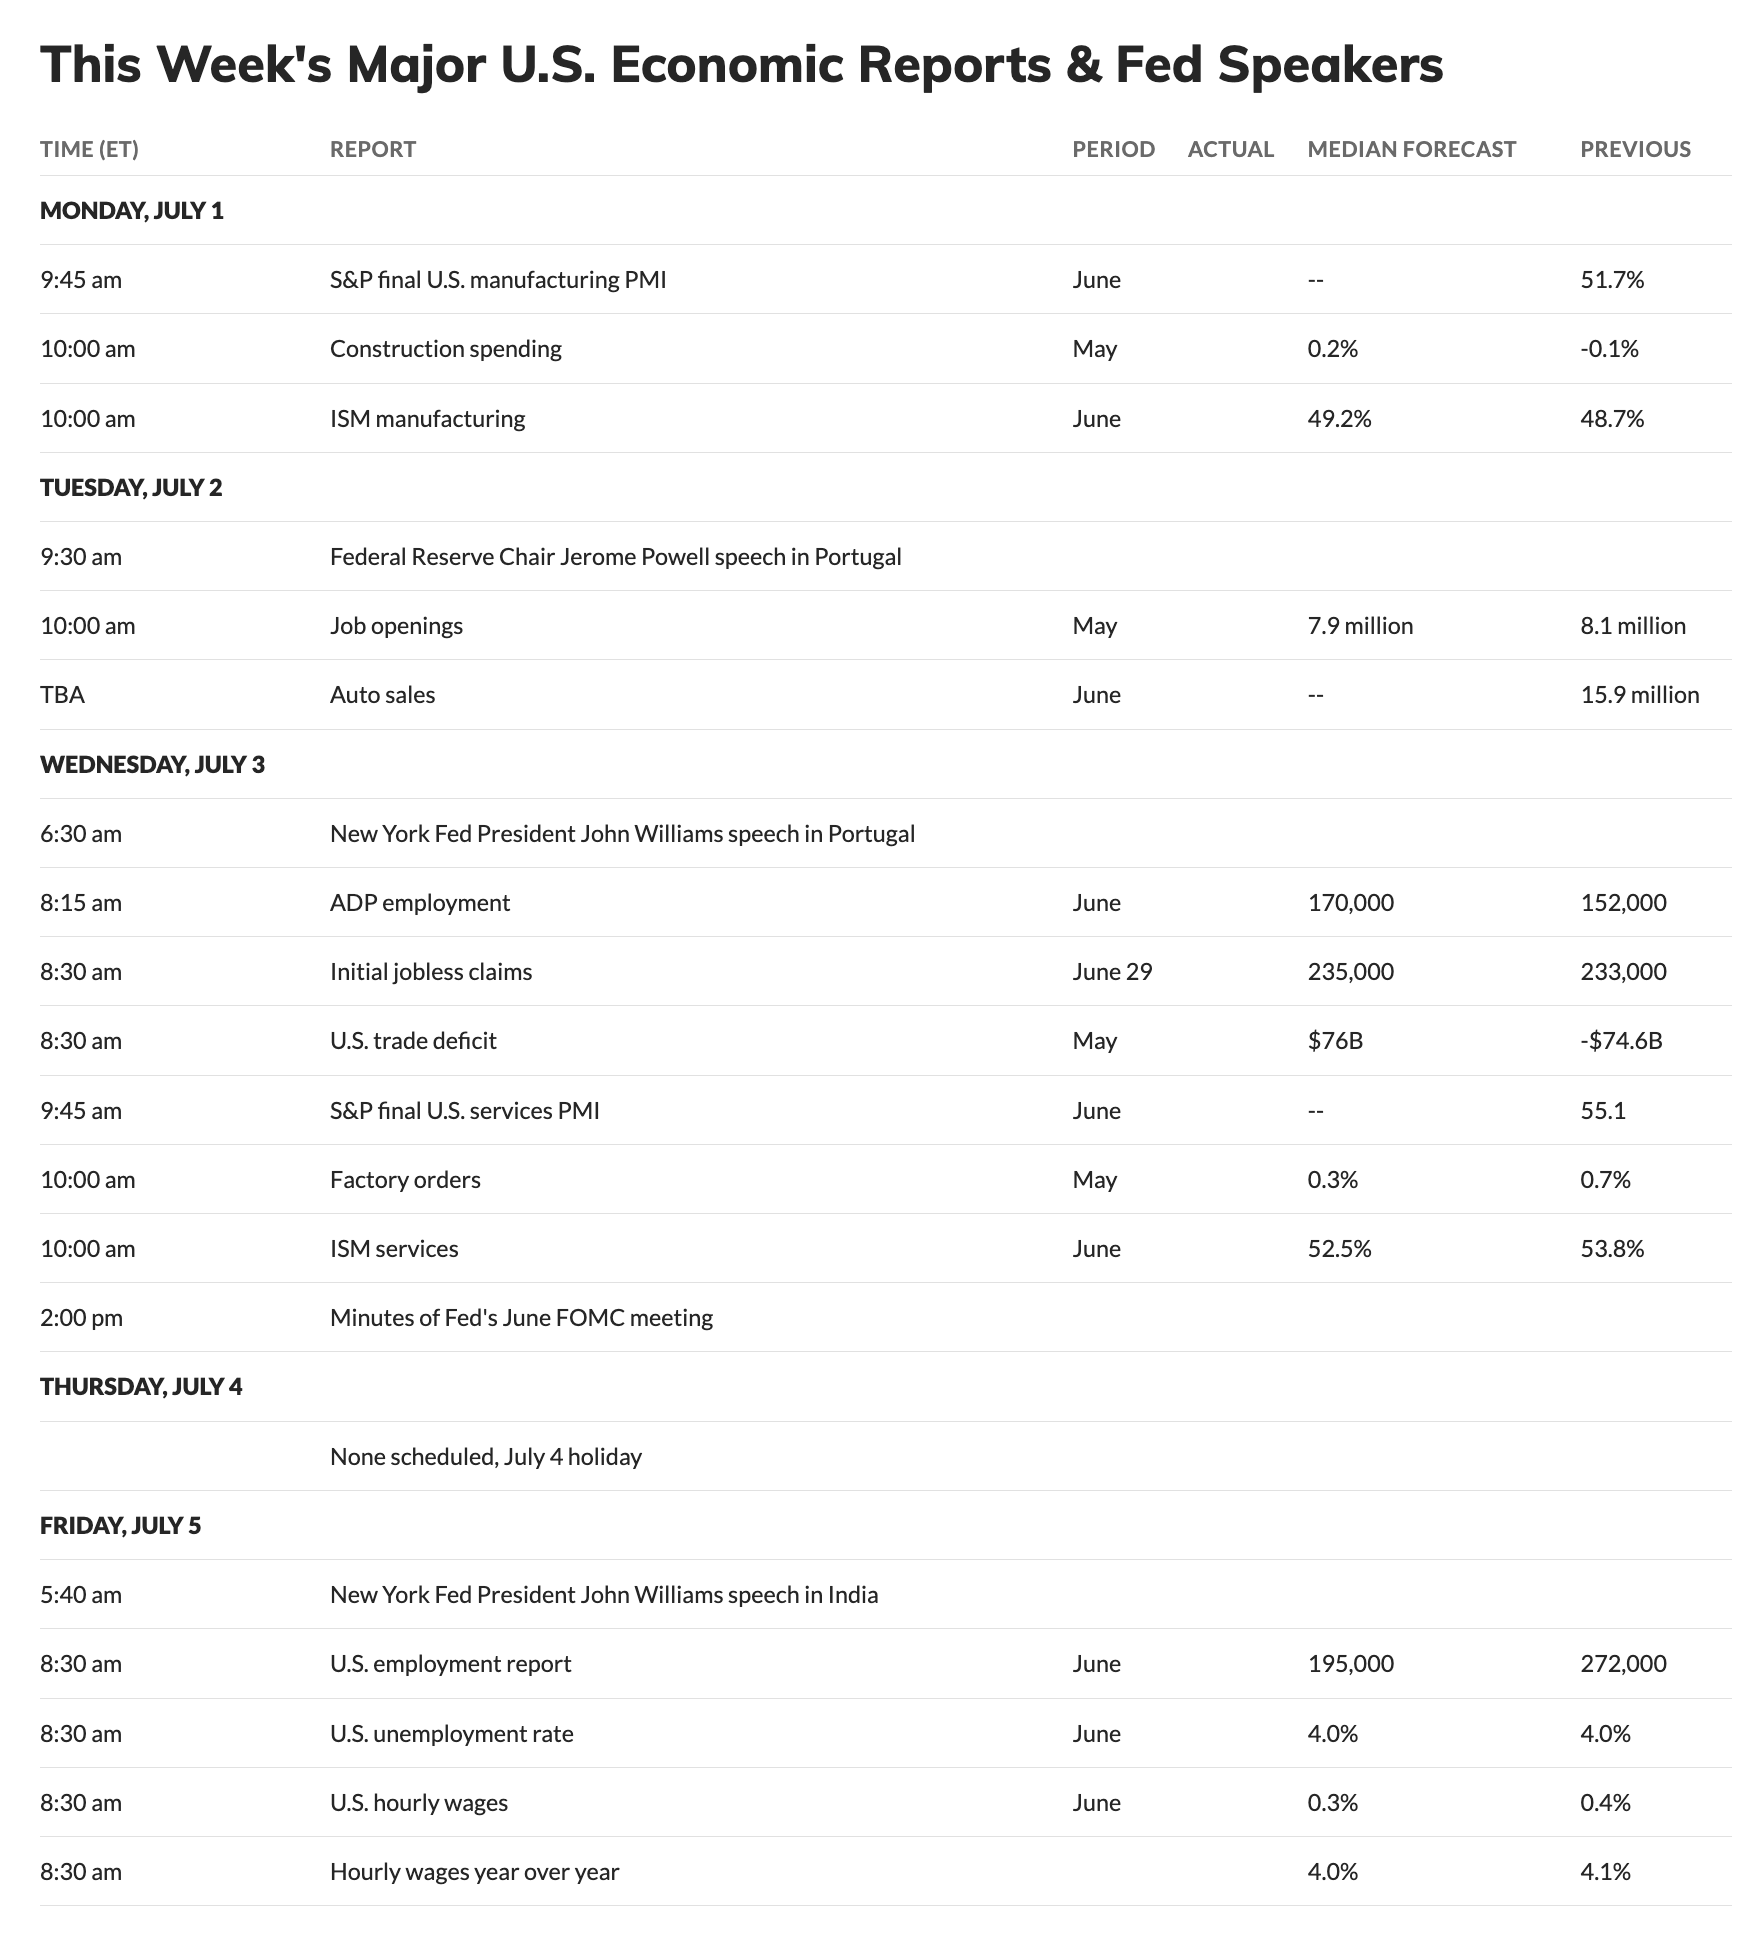
Weekly Market Economic Calendar

Source: MarketWatch

Weekly Learning Focus

Do you understand and/or use MACD on your charting while trading❓

The MACD is one of the most commonly used technical analysis tools out there❗️

If the signal line and the MACD line come together, it’s called ‘converging’ 👉 👈
If they are moving away from each other it’s called ‘diverging’ 👈 👉

Strategies: 3 of the most common MACD strategies include:

1️⃣ Crossovers
2️⃣ Histogram Reversals
3️⃣ Zero Crosses.

*Interested in becoming an Affiliate? Join the Pure Power Picks Affiliate Program! Sign up now to become an affiliate marketer and earn money on every successful sign up you send our way! Click the button below to sign up now!