Pure Power Picks Weekly Watchlist

Stocks To Watch – 3/4/2024

It's Free Watchlist Week!

We recently made the watchlist only accessible to Pure Power Picks Members. However, Once a month we send the entire Watchlist to everyone for free.

If you're not yet a member, Sign up now and get every Watchlist, every Week! You will also receive the Pure Power Picks 3-5 Weekly Options Trading Alerts!

If you're already a member with Pure Power Picks, please Login to access the Full Market Brief & Stocks To Watch content.

*Remember, as a subscriber on our email list YOU WILL RECEIVE:

    • 1 FREE Options Trade Alert per month
    • 1 FREE Weekly Watchlist per month

Brief Overview

Hello Traders & Investors,

Scroll down to see the stocks we have on watch this week 👀!

The bulls are making their presence in the SPY know for the last 4 months logging only 2 red weeks. As we kick off the last month of of the first quarter of the year. We’re interested to see if we’ll see more all time highs or if the market will start to cool down as winter comes to a close and temperatures warm up.

As always, alerts of any A+ options setups will be sent to Pure Power Picks Members immediately!

Recent Winners Tracking

DIS…99% from 2/27
PANW…642%
from 2/22
W…83% from 2/22
TSLA…82%
from 2/15
PDD…142% from 2/14
DG…144%
from 2/12
AMZN…61%
from 2/8
OXY…33% from 2/7
GOOGL…63%
from 2/6
APP…318%
from 1/30
*Max gain potential on options alerted so far/before expiration.

View all PPP’s alert performance with the Member’s Only Alert Tracker!

Weekly Learning Focus

If you are interested in trading options, position sizing is the most important aspect‼️
(besides risk management)

Sizing is key for options traders to understand. 👀
Check out this simple table we created and have a plan that includes sizing into your positions.
Sizing should be a part of the trade plan from the start, not randomly or willy-nilly 💯
Don’t add to losing positions just to add. 👎
Make sure it’s part of the plan ✅
Know what you’re doing🎯

Now more than ever, data is king. We built our Trading Room as a hub of data driven, market related information and AI predictions, separated neatly into their respective channels. Shut out all of the outside noise. Focus on the data you care about and make informed decisions.

We are now offering a 7 day trial to our Premium Trading Room for just $5! If you’ve been wanting to try out all of the Premium channels in our Trading Room, there’s no better time than right now!

Market Brief

S&P 500 ETF (Ticker: SPY) – Weekly Chart

Opened last week at: $508.30
Hit a weekly high of: $513.29 on Fri 3/1
Hit the low of the week of: $504.75 on Tues 2/27
Closed the week at: $512.85

The SPY has, for the most part, been non stop in 2024 seeing a new high almost every week. After making a new high Friday at the $513.29 mark, we will have a close eye on the open to see if the bulls maintain control. Look for an early move over $513.29 to confirm demand. If this level holds we could see moves up to $515 – $520 and possibly the $525 psych level.

On the flip side, if the bears smell spring and come out of hibernation things could get ugly. Look to the $508 level for the first sign of support. If $508 fails we could see the $500 psych level tested. Failure at this level could lead to deeper slides to $494 and beyond.

Weekly Chart

Charts Provided By: Finviz

Weekly Stocks to Watch

Here’s some of the stocks we have on watch for the beginning of the week…

As always, we’ll be heavily focused on our news feeds & scanners for prime opportunities throughout the week.

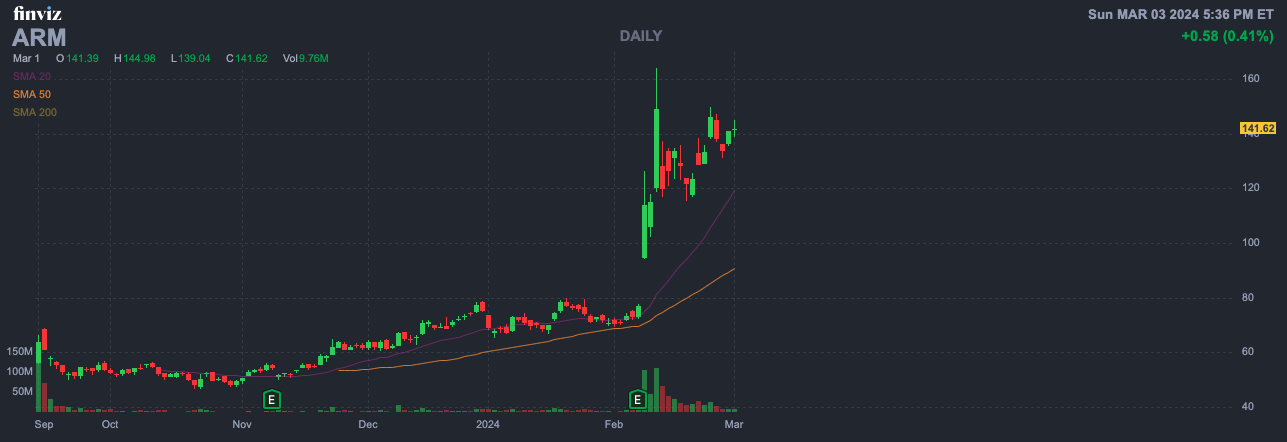
Arm Holdings PLC. (Ticker: ARM)

We will be focusing on ARM for continuation to the upside. Arm had a huge move up this year (February) and it has been holding it’s trend very well. This is a sign of strength and a great looking setup for bulls. Use $140 – $135 as support and potential buy opportunities to catch the upside moves. We will be watching for a move back to $150 and a breakout to past highs of $164+.

Daily Chart

Snowflake Inc. (Ticker: SNOW)

Took a beating in price after earnings this week. We will see how this reacts in the coming weeks. We may see a bounce back in price, and that’s what we are looking to trade for upside. Bulls will want to see SNOW break over $194.25 for a gap fill opportunity towards $200 – $210 – $225 – $240. SNOW is now at past supply levels after price drop post earnings. So we can anticipate there to be strong support in the $183 – $178 range. Look for those zones to be buy opportunities for bounce back into the $200s and beyond. If $180 fails to hold look out for downside moves into the $170s and possibly $160s.

Daily Chart

GameStop Corp. (Ticker: GME)

We noticed GME pop up on Trading Room Scanners towards the end of the week closing strong on Friday. We will be watching GME for a continuation of that move. Look for upside moves to $17.5 – $20 targets if $15 holds support. However, if $15.25 doesn’t break to the upside, there may be better plays out there.

Daily Chart

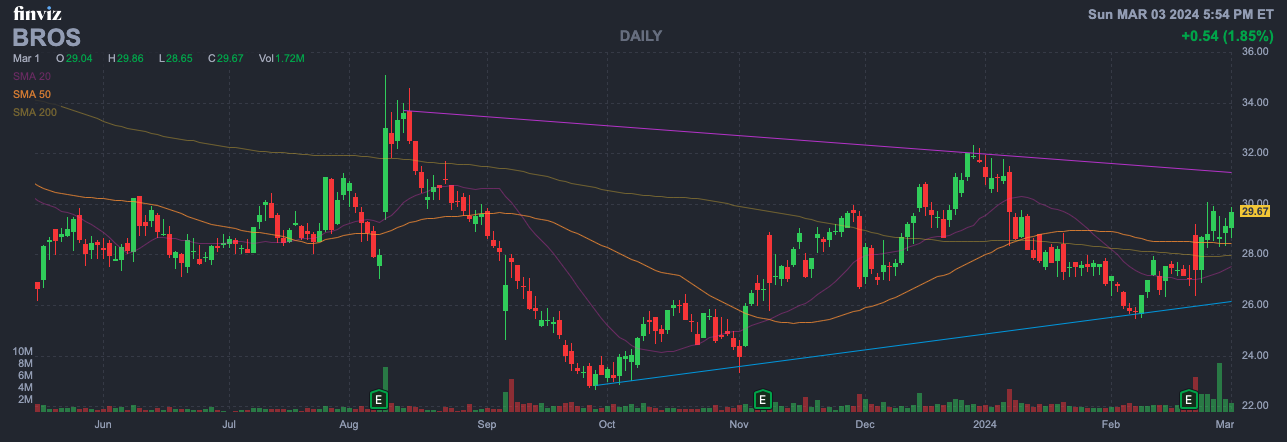
Dutch Bros Inc. (Ticker: BROS)

This has been in an extended downtrend in the big picture, but it is likely we see BROS break out of it. Watching these levels for confirmation. Support from $29 – $28.50 – 27.50. Use that range as support to build position for swing potential moves to $30 break and upside towards $32.50 – $35 – $36 and a deeper target of $40 with time.

Daily Chart

Affirm Holdings Inc. (Ticker: AFRM)

We just alerted AFRM this past week. We want to make sure that there is focus here for potential high reward. Right now, expect to see support $37-34. This could be an excellent range to buy/build position in anticipation of the upside move towards $50-52.5. If this scenario plays out and we see $52.5 break to upside, we can see a deeper 2024 swing target in the $70s hitting as AFRM can move quick and squeeze shorts.

Daily Chart

Tesla Inc. (Ticker: TSLA)

Big name trading in a consistent uptrend since February lows off $175/$180 tests. Now back above $200 and testing the gap level and former support at $206, this could be ripe for a $215 – $220 rip in bullish conditions. Alternatively, if sellers emerge with strength, this could be retesting $200, ultimately $190 support.

Daily Chart

Bitcoin (BTCUSD) – Price Action

Bitcoin is now holding $60k range. If you anticipate BTC to keep running over it’s latest high / above $64.3k, look towards these calls once again with the appropriate time on contracts, as they could get another huge boost in premium.

Daily Chart

Our top 3 crypto names to trade for a bullish breakout in the event BTC breaks recent highs.

Coinbase Global (Ticker: COIN)

If we see BTC break recent highs we will be looking at COIN $220 – $230 calls

Daily Chart

Marathon Digital (Ticker: MARA)

If we see BTC break recent highs we will be looking at MARA $30 calls

Daily Chart

Riot Platforms Inc. (Ticker: RIOT)

If we see BTC break recent highs we will be looking at RIOT $20 calls
Daily Chart

We have other names on watch and we’ll continue to monitor our breaking news feeds and stock & option scanners to help make the smartest picks with the most potential throughout the week!

Weekly Market Earnings Calendar

Most Anticipated Earnings Releases This Week

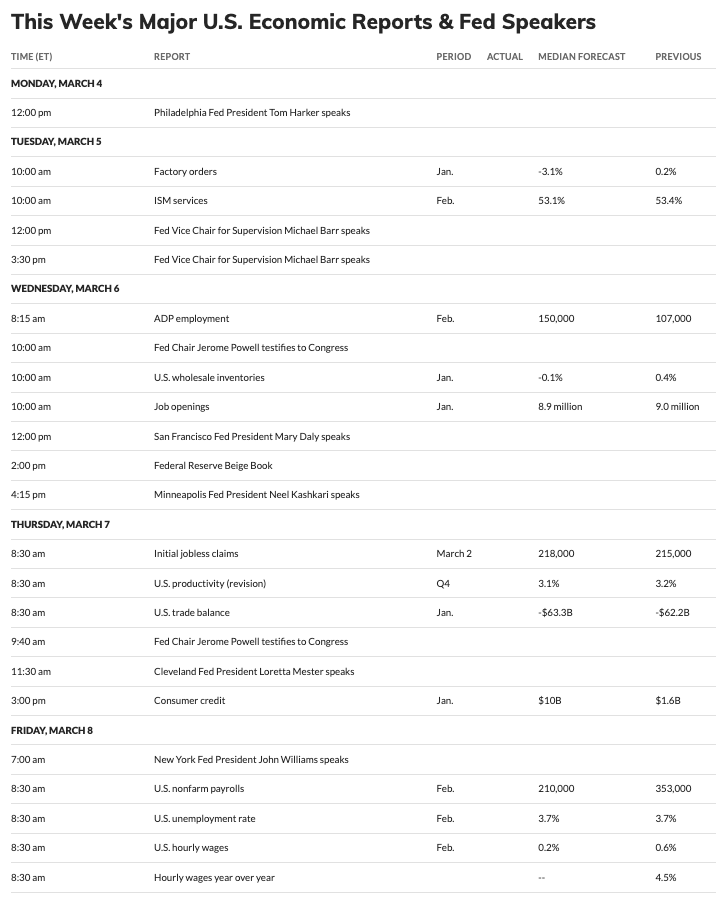
Weekly Market Economic Calendar

Source: MarketWatch

Ready For An Alerts🚨 Membership?

We offer a 100% completely FREE 7 Day Trial, so you literally pay nothing to try out our service for a week. Receive 3-5 trade alerts THIS WEEK.

If you decide that we aren’t the right fit for your type of trading, you can easily cancel your membership any time before the 7 days is up, and you won’t be charged.

The Trial even INCLUDES our SMS/Text📲 Alerts, which most of our members choose to opt into.

*Interested in becoming an Affiliate? Join the Pure Power Picks Affiliate Program! Sign up now to become an affiliate marketer and earn money on every successful sign up you send our way! Click the button below to sign up now!